Advertisement
Ruby Mills (NSE:RUBYMILLS) Has Some Difficulty Using Its Capital Effectively
When we're researching a company, it's sometimes hard to find the warning signs, but there are some financial metrics that can help spot trouble early. When we see a declining return on capital employed (ROCE) in conjunction with a declining base of capital employed, that's often how a mature business shows signs of aging. This indicates the company is producing less profit from its investments and its total assets are decreasing. And from a first read, things don't look too good at Ruby Mills (NSE:RUBYMILLS), so let's see why.
Understanding Return On Capital Employed (ROCE)
For those that aren't sure what ROCE is, it measures the amount of pre-tax profits a company can generate from the capital employed in its business. The formula for this calculation on Ruby Mills is:
Return on Capital Employed = Earnings Before Interest and Tax (EBIT) ÷ (Total Assets - Current Liabilities)
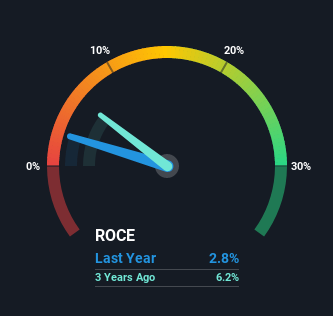
0.028 = ₹234m ÷ (₹10b - ₹2.0b) (Based on the trailing twelve months to December 2020).
Thus, Ruby Mills has an ROCE of 2.8%. Ultimately, that's a low return and it under-performs the Luxury industry average of 9.6%.
See our latest analysis for Ruby Mills
While the past is not representative of the future, it can be helpful to know how a company has performed historically, which is why we have this chart above. If you want to delve into the historical earnings, revenue and cash flow of Ruby Mills, check out these free graphs here.
What Can We Tell From Ruby Mills' ROCE Trend?
In terms of Ruby Mills' historical ROCE movements, the trend doesn't inspire confidence. To be more specific, the ROCE was 5.8% five years ago, but since then it has dropped noticeably. And on the capital employed front, the business is utilizing roughly the same amount of capital as it was back then. This combination can be indicative of a mature business that still has areas to deploy capital, but the returns received aren't as high due potentially to new competition or smaller margins. If these trends continue, we wouldn't expect Ruby Mills to turn into a multi-bagger.
On a side note, Ruby Mills has done well to pay down its current liabilities to 20% of total assets. So we could link some of this to the decrease in ROCE. What's more, this can reduce some aspects of risk to the business because now the company's suppliers or short-term creditors are funding less of its operations. Some would claim this reduces the business' efficiency at generating ROCE since it is now funding more of the operations with its own money.
The Key Takeaway
In summary, it's unfortunate that Ruby Mills is generating lower returns from the same amount of capital. Investors haven't taken kindly to these developments, since the stock has declined 36% from where it was five years ago. With underlying trends that aren't great in these areas, we'd consider looking elsewhere.
If you want to know some of the risks facing Ruby Mills we've found 5 warning signs (2 are a bit concerning!) that you should be aware of before investing here.
While Ruby Mills isn't earning the highest return, check out this free list of companies that are earning high returns on equity with solid balance sheets.
If you’re looking to trade Ruby Mills, open an account with the lowest-cost* platform trusted by professionals, Interactive Brokers. Their clients from over 200 countries and territories trade stocks, options, futures, forex, bonds and funds worldwide from a single integrated account. Promoted
New: AI Stock Screener & Alerts
Our new AI Stock Screener scans the market every day to uncover opportunities.
• Dividend Powerhouses (3%+ Yield)
• Undervalued Small Caps with Insider Buying
• High growth Tech and AI Companies
Or build your own from over 50 metrics.
This article by Simply Wall St is general in nature. It does not constitute a recommendation to buy or sell any stock, and does not take account of your objectives, or your financial situation. We aim to bring you long-term focused analysis driven by fundamental data. Note that our analysis may not factor in the latest price-sensitive company announcements or qualitative material. Simply Wall St has no position in any stocks mentioned.
*Interactive Brokers Rated Lowest Cost Broker by StockBrokers.com Annual Online Review 2020
Have feedback on this article? Concerned about the content? Get in touch with us directly. Alternatively, email editorial-team (at) simplywallst.com.
About NSEI:RUBYMILLS
Ruby Mills
Engages in the manufacture of textile products in India.
Slight risk with mediocre balance sheet.
Market Insights


Advertisement
Weekly Picks
CE


Ceazar on Sparc AI ·
When GPS fails: this small cap is fixing a $54B drone problem
Fair Value:CA$5.2550.7% undervalued
116 followersusers have followed this narrative
0 commentsusers have commented on this narrative
25 likesusers have liked this narrative
BL


BlackGoat on IREN ·
IREN's Bold Moves in Sustainable Bitcoin Mining & AI Data Centers
Fair Value:US$71.4846.5% undervalued
219 followersusers have followed this narrative
8 commentsusers have commented on this narrative
33 likesusers have liked this narrative
HE


HedgeY on Arm Holdings ·
The Architecture Layer of AI Computing - But Priced Like the Future Already Arrived?
Fair Value:US$43043.8% undervalued
22 followersusers have followed this narrative
1 commentusers have commented on this narrative
6 likesusers have liked this narrative
HI


Hidden_Rock_Capital on Fiserv ·
Temporary "perfect storm" leads to opportunity to buy financial services leader for less than 5x long-term earnings
Fair Value:US$119.9954.9% undervalued
30 followersusers have followed this narrative
1 commentusers have commented on this narrative
10 likesusers have liked this narrative
Recently Updated Narratives
JO


John_Eric on Meta Platforms ·
META: The Tide Just Went Out. Let's See Who's Dressed.
Fair Value:US$778.9330.8% undervalued
1 followerusers have followed this narrative
0 commentsusers have commented on this narrative
0 likesusers have liked this narrative
JO

John_Eric on Microsoft ·
Microsoft (MSFT): The AI Bull Case Everyone Sees, Trading at a Multiple Nobody's Willing to Pay
Fair Value:US$60024.8% undervalued
31 followersusers have followed this narrative
0 commentsusers have commented on this narrative
0 likesusers have liked this narrative
TR


TripleS on Dong A Eltek ·
Dong-A Eltek (088130 on the KOSDAQ) trades at ₩4,325 and owns about ₩17,780 per share of assets
Fair Value:₩6.31k21.8% undervalued
1 followerusers have followed this narrative
0 commentsusers have commented on this narrative
0 likesusers have liked this narrative
Popular Narratives
OS


oscargarcia on NVIDIA ·
The company that went from selling GPUs to gamers to becoming the AI arms dealer of the 21st century.
Fair Value:US$28030.3% undervalued
217 followersusers have followed this narrative
9 commentsusers have commented on this narrative
15 likesusers have liked this narrative
CU
CubanEros on Microsoft ·
A wonderful business at reasonable price.
Fair Value:US$419.917.4% overvalued
101 followersusers have followed this narrative
0 commentsusers have commented on this narrative
7 likesusers have liked this narrative
BE

benjamin_lvieq on PayPal Holdings ·
PayPal: PayPal Doesn't Need to Grow – It Needs to Stop Falling – A Mispriced Cash Machine With a Cannibal Buyback
Fair Value:US$6511.3% undervalued
75 followersusers have followed this narrative
2 commentsusers have commented on this narrative
11 likesusers have liked this narrative
Trending Discussion
GR
greg_xasak on Fiserv ·
As someone who has dealt directly with them as a CTO for a credit union, I have 8 years of horror stories about doing business with them. If there was any other competitor than could deliver 80% of Fiserv services, there would be a mad rush to migrate to them. They should thank their lucky stars they are a near monopoly. this industry is so ripe for a well funded competitor. Their integration of technology is awful, their ability to fix their own implementation screwups is sadly tragic. Sometimes they just silently kill support tickets without resolution and you never find out until you do a follow up inquiry. Why, because sometimes no one you are dealing with knows how to fix it and knows no one to ask for help. They can not meet their own implementation deadlines and sometimes there is no one on a technical team dealing with you that has any banking or credit union experience. The is an industry insider phrase when you meet other Fiserv customers called being "Fiserved". It means telling others of your worst stories of dealing with them. Ask around, all CTO's have some doozies.
1
|0

BL

Blegells on Terra Balcanica Resources ·
⏫42X THE AVERAGE DAILY TRADING VOLUME TODAY, JULY 28 🐂🐂🐂 FORTY-TWO!
1
|0