Cantabil Retail India (NSE:CANTABIL) Might Be Having Difficulty Using Its Capital Effectively


If we want to find a stock that could multiply over the long term, what are the underlying trends we should look for? One common approach is to try and find a company with returns on capital employed (ROCE) that are increasing, in conjunction with a growing amount of capital employed. Ultimately, this demonstrates that it's a business that is reinvesting profits at increasing rates of return. However, after briefly looking over the numbers, we don't think Cantabil Retail India (NSE:CANTABIL) has the makings of a multi-bagger going forward, but let's have a look at why that may be.
What is Return On Capital Employed (ROCE)?
For those that aren't sure what ROCE is, it measures the amount of pre-tax profits a company can generate from the capital employed in its business. Analysts use this formula to calculate it for Cantabil Retail India:
Return on Capital Employed = Earnings Before Interest and Tax (EBIT) ÷ (Total Assets - Current Liabilities)
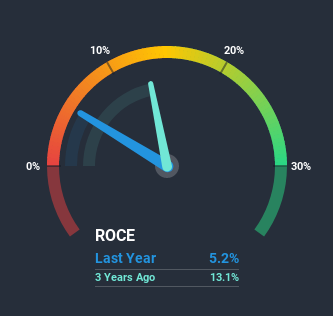
0.052 = ₹169m ÷ (₹4.3b - ₹1.1b) (Based on the trailing twelve months to December 2020).
Therefore, Cantabil Retail India has an ROCE of 5.2%. In absolute terms, that's a low return and it also under-performs the Luxury industry average of 9.4%.
View our latest analysis for Cantabil Retail India
While the past is not representative of the future, it can be helpful to know how a company has performed historically, which is why we have this chart above. If you want to delve into the historical earnings, revenue and cash flow of Cantabil Retail India, check out these free graphs here.
So How Is Cantabil Retail India's ROCE Trending?
When we looked at the ROCE trend at Cantabil Retail India, we didn't gain much confidence. To be more specific, ROCE has fallen from 13% over the last five years. And considering revenue has dropped while employing more capital, we'd be cautious. This could mean that the business is losing its competitive advantage or market share, because while more money is being put into ventures, it's actually producing a lower return - "less bang for their buck" per se.
On a side note, Cantabil Retail India has done well to pay down its current liabilities to 26% of total assets. So we could link some of this to the decrease in ROCE. What's more, this can reduce some aspects of risk to the business because now the company's suppliers or short-term creditors are funding less of its operations. Some would claim this reduces the business' efficiency at generating ROCE since it is now funding more of the operations with its own money.
The Key Takeaway
In summary, we're somewhat concerned by Cantabil Retail India's diminishing returns on increasing amounts of capital. Since the stock has skyrocketed 454% over the last five years, it looks like investors have high expectations of the stock. In any case, the current underlying trends don't bode well for long term performance so unless they reverse, we'd start looking elsewhere.
If you want to know some of the risks facing Cantabil Retail India we've found 5 warning signs (1 doesn't sit too well with us!) that you should be aware of before investing here.
While Cantabil Retail India isn't earning the highest return, check out this free list of companies that are earning high returns on equity with solid balance sheets.
If you’re looking to trade Cantabil Retail India, open an account with the lowest-cost* platform trusted by professionals, Interactive Brokers. Their clients from over 200 countries and territories trade stocks, options, futures, forex, bonds and funds worldwide from a single integrated account. Promoted
New: AI Stock Screener & Alerts
Our new AI Stock Screener scans the market every day to uncover opportunities.
• Dividend Powerhouses (3%+ Yield)
• Undervalued Small Caps with Insider Buying
• High growth Tech and AI Companies
Or build your own from over 50 metrics.
This article by Simply Wall St is general in nature. It does not constitute a recommendation to buy or sell any stock, and does not take account of your objectives, or your financial situation. We aim to bring you long-term focused analysis driven by fundamental data. Note that our analysis may not factor in the latest price-sensitive company announcements or qualitative material. Simply Wall St has no position in any stocks mentioned.
*Interactive Brokers Rated Lowest Cost Broker by StockBrokers.com Annual Online Review 2020
Have feedback on this article? Concerned about the content? Get in touch with us directly. Alternatively, email editorial-team (at) simplywallst.com.
About NSEI:CANTABIL
Cantabil Retail India
Engages in designing, manufacturing, branding, and retailing apparel and apparel accessories in India.
Excellent balance sheet second-rate dividend payer.
