

Key Insights
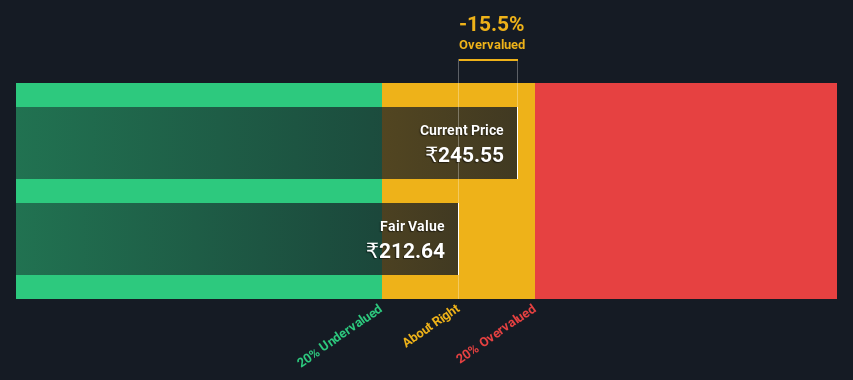
- The projected fair value for Rail Vikas Nigam is ₹213 based on 2 Stage Free Cash Flow to Equity
- Rail Vikas Nigam's ₹246 share price indicates it is trading at similar levels as its fair value estimate
- Rail Vikas Nigam's peers seem to be trading at a higher premium to fair value based onthe industry average of -566%
Does the March share price for Rail Vikas Nigam Limited (NSE:RVNL) reflect what it's really worth? Today, we will estimate the stock's intrinsic value by taking the expected future cash flows and discounting them to today's value. Our analysis will employ the Discounted Cash Flow (DCF) model. Believe it or not, it's not too difficult to follow, as you'll see from our example!
Remember though, that there are many ways to estimate a company's value, and a DCF is just one method. For those who are keen learners of equity analysis, the Simply Wall St analysis model here may be something of interest to you.
View our latest analysis for Rail Vikas Nigam
The Method
We are going to use a two-stage DCF model, which, as the name states, takes into account two stages of growth. The first stage is generally a higher growth period which levels off heading towards the terminal value, captured in the second 'steady growth' period. In the first stage we need to estimate the cash flows to the business over the next ten years. Seeing as no analyst estimates of free cash flow are available to us, we have extrapolate the previous free cash flow (FCF) from the company's last reported value. We assume companies with shrinking free cash flow will slow their rate of shrinkage, and that companies with growing free cash flow will see their growth rate slow, over this period. We do this to reflect that growth tends to slow more in the early years than it does in later years.
A DCF is all about the idea that a dollar in the future is less valuable than a dollar today, so we discount the value of these future cash flows to their estimated value in today's dollars:
10-year free cash flow (FCF) estimate
| 2024 | 2025 | 2026 | 2027 | 2028 | 2029 | 2030 | 2031 | 2032 | 2033 | |
| Levered FCF (₹, Millions) | ₹33.9b | ₹37.4b | ₹40.9b | ₹44.3b | ₹47.8b | ₹51.5b | ₹55.2b | ₹59.2b | ₹63.3b | ₹67.7b |
| Growth Rate Estimate Source | Est @ 11.80% | Est @ 10.27% | Est @ 9.21% | Est @ 8.46% | Est @ 7.93% | Est @ 7.57% | Est @ 7.31% | Est @ 7.13% | Est @ 7.00% | Est @ 6.92% |
| Present Value (₹, Millions) Discounted @ 15% | ₹29.5k | ₹28.3k | ₹26.8k | ₹25.3k | ₹23.7k | ₹22.2k | ₹20.7k | ₹19.3k | ₹17.9k | ₹16.7k |
("Est" = FCF growth rate estimated by Simply Wall St)
Present Value of 10-year Cash Flow (PVCF) = ₹230b
We now need to calculate the Terminal Value, which accounts for all the future cash flows after this ten year period. The Gordon Growth formula is used to calculate Terminal Value at a future annual growth rate equal to the 5-year average of the 10-year government bond yield of 6.7%. We discount the terminal cash flows to today's value at a cost of equity of 15%.
Terminal Value (TV)= FCF2033 × (1 + g) ÷ (r – g) = ₹68b× (1 + 6.7%) ÷ (15%– 6.7%) = ₹866b
Present Value of Terminal Value (PVTV)= TV / (1 + r)10= ₹866b÷ ( 1 + 15%)10= ₹213b
The total value, or equity value, is then the sum of the present value of the future cash flows, which in this case is ₹443b. In the final step we divide the equity value by the number of shares outstanding. Relative to the current share price of ₹246, the company appears around fair value at the time of writing. Valuations are imprecise instruments though, rather like a telescope - move a few degrees and end up in a different galaxy. Do keep this in mind.
Important Assumptions
We would point out that the most important inputs to a discounted cash flow are the discount rate and of course the actual cash flows. You don't have to agree with these inputs, I recommend redoing the calculations yourself and playing with them. The DCF also does not consider the possible cyclicality of an industry, or a company's future capital requirements, so it does not give a full picture of a company's potential performance. Given that we are looking at Rail Vikas Nigam as potential shareholders, the cost of equity is used as the discount rate, rather than the cost of capital (or weighted average cost of capital, WACC) which accounts for debt. In this calculation we've used 15%, which is based on a levered beta of 1.068. Beta is a measure of a stock's volatility, compared to the market as a whole. We get our beta from the industry average beta of globally comparable companies, with an imposed limit between 0.8 and 2.0, which is a reasonable range for a stable business.
SWOT Analysis for Rail Vikas Nigam
- Debt is not viewed as a risk.
- Dividends are covered by earnings and cash flows.
- Earnings growth over the past year underperformed the Construction industry.
- Dividend is low compared to the top 25% of dividend payers in the Construction market.
- Annual revenue is forecast to grow faster than the Indian market.
- Good value based on P/E ratio compared to estimated Fair P/E ratio.
- No apparent threats visible for RVNL.
Moving On:
Although the valuation of a company is important, it shouldn't be the only metric you look at when researching a company. It's not possible to obtain a foolproof valuation with a DCF model. Instead the best use for a DCF model is to test certain assumptions and theories to see if they would lead to the company being undervalued or overvalued. If a company grows at a different rate, or if its cost of equity or risk free rate changes sharply, the output can look very different. For Rail Vikas Nigam, we've compiled three additional elements you should explore:
- Risks: Take risks, for example - Rail Vikas Nigam has 2 warning signs (and 1 which can't be ignored) we think you should know about.
- Future Earnings: How does RVNL's growth rate compare to its peers and the wider market? Dig deeper into the analyst consensus number for the upcoming years by interacting with our free analyst growth expectation chart.
- Other High Quality Alternatives: Do you like a good all-rounder? Explore our interactive list of high quality stocks to get an idea of what else is out there you may be missing!
PS. The Simply Wall St app conducts a discounted cash flow valuation for every stock on the NSEI every day. If you want to find the calculation for other stocks just search here.
New: AI Stock Screener & Alerts
Our new AI Stock Screener scans the market every day to uncover opportunities.
• Dividend Powerhouses (3%+ Yield)
• Undervalued Small Caps with Insider Buying
• High growth Tech and AI Companies
Or build your own from over 50 metrics.
Have feedback on this article? Concerned about the content? Get in touch with us directly. Alternatively, email editorial-team (at) simplywallst.com.
This article by Simply Wall St is general in nature. We provide commentary based on historical data and analyst forecasts only using an unbiased methodology and our articles are not intended to be financial advice. It does not constitute a recommendation to buy or sell any stock, and does not take account of your objectives, or your financial situation. We aim to bring you long-term focused analysis driven by fundamental data. Note that our analysis may not factor in the latest price-sensitive company announcements or qualitative material. Simply Wall St has no position in any stocks mentioned.
About NSEI:RVNL
Rail Vikas Nigam
Engages in the construction of rail infrastructure projects in India.
Excellent balance sheet second-rate dividend payer.
Similar Companies
Market Insights

Community Narratives
