The Returns At Confidence Petroleum India (NSE:CONFIPET) Aren't Growing


What are the early trends we should look for to identify a stock that could multiply in value over the long term? In a perfect world, we'd like to see a company investing more capital into its business and ideally the returns earned from that capital are also increasing. This shows us that it's a compounding machine, able to continually reinvest its earnings back into the business and generate higher returns. With that in mind, the ROCE of Confidence Petroleum India (NSE:CONFIPET) looks decent, right now, so lets see what the trend of returns can tell us.
Understanding Return On Capital Employed (ROCE)
For those who don't know, ROCE is a measure of a company's yearly pre-tax profit (its return), relative to the capital employed in the business. The formula for this calculation on Confidence Petroleum India is:
Return on Capital Employed = Earnings Before Interest and Tax (EBIT) ÷ (Total Assets - Current Liabilities)
0.15 = ₹2.0b ÷ (₹18b - ₹5.3b) (Based on the trailing twelve months to December 2023).
So, Confidence Petroleum India has an ROCE of 15%. In absolute terms, that's a pretty normal return, and it's somewhat close to the Machinery industry average of 18%.
View our latest analysis for Confidence Petroleum India
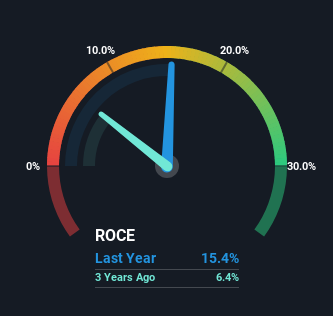
Historical performance is a great place to start when researching a stock so above you can see the gauge for Confidence Petroleum India's ROCE against it's prior returns. If you're interested in investigating Confidence Petroleum India's past further, check out this free graph covering Confidence Petroleum India's past earnings, revenue and cash flow.
What Does the ROCE Trend For Confidence Petroleum India Tell Us?
While the returns on capital are good, they haven't moved much. The company has employed 161% more capital in the last five years, and the returns on that capital have remained stable at 15%. 15% is a pretty standard return, and it provides some comfort knowing that Confidence Petroleum India has consistently earned this amount. Stable returns in this ballpark can be unexciting, but if they can be maintained over the long run, they often provide nice rewards to shareholders.
On another note, while the change in ROCE trend might not scream for attention, it's interesting that the current liabilities have actually gone up over the last five years. This is intriguing because if current liabilities hadn't increased to 29% of total assets, this reported ROCE would probably be less than15% because total capital employed would be higher.The 15% ROCE could be even lower if current liabilities weren't 29% of total assets, because the the formula would show a larger base of total capital employed. So while current liabilities isn't high right now, keep an eye out in case it increases further, because this can introduce some elements of risk.
Our Take On Confidence Petroleum India's ROCE
The main thing to remember is that Confidence Petroleum India has proven its ability to continually reinvest at respectable rates of return. And the stock has done incredibly well with a 133% return over the last three years, so long term investors are no doubt ecstatic with that result. So even though the stock might be more "expensive" than it was before, we think the strong fundamentals warrant this stock for further research.
On a separate note, we've found 3 warning signs for Confidence Petroleum India you'll probably want to know about.
While Confidence Petroleum India isn't earning the highest return, check out this free list of companies that are earning high returns on equity with solid balance sheets.
If you're looking to trade Confidence Petroleum India, open an account with the lowest-cost platform trusted by professionals, Interactive Brokers.
With clients in over 200 countries and territories, and access to 160 markets, IBKR lets you trade stocks, options, futures, forex, bonds and funds from a single integrated account.
Enjoy no hidden fees, no account minimums, and FX conversion rates as low as 0.03%, far better than what most brokers offer.
Sponsored ContentNew: AI Stock Screener & Alerts
Our new AI Stock Screener scans the market every day to uncover opportunities.
• Dividend Powerhouses (3%+ Yield)
• Undervalued Small Caps with Insider Buying
• High growth Tech and AI Companies
Or build your own from over 50 metrics.
Have feedback on this article? Concerned about the content? Get in touch with us directly. Alternatively, email editorial-team (at) simplywallst.com.
This article by Simply Wall St is general in nature. We provide commentary based on historical data and analyst forecasts only using an unbiased methodology and our articles are not intended to be financial advice. It does not constitute a recommendation to buy or sell any stock, and does not take account of your objectives, or your financial situation. We aim to bring you long-term focused analysis driven by fundamental data. Note that our analysis may not factor in the latest price-sensitive company announcements or qualitative material. Simply Wall St has no position in any stocks mentioned.
About NSEI:CONFIPET
Confidence Petroleum India
Engages in the manufacture and sale of liquefied petroleum gas (LPG) cylinders in India.
Slightly overvalued with questionable track record.
Similar Companies
Market Insights

Community Narratives
