
Key Insights
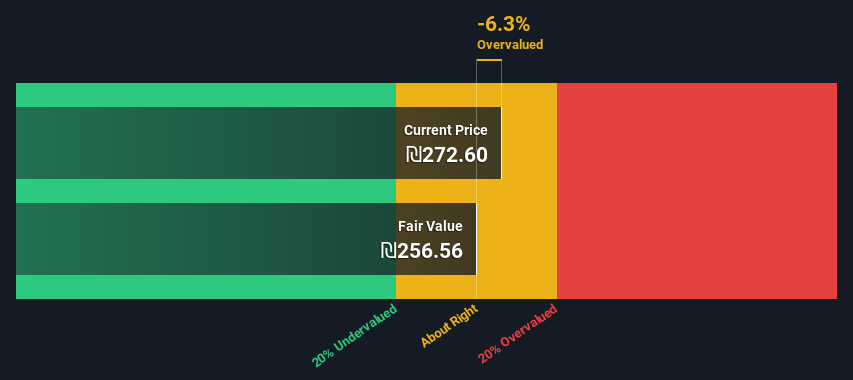
- Using the 2 Stage Free Cash Flow to Equity, Fox-Wizel fair value estimate is ₪257
- Fox-Wizel's ₪273 share price indicates it is trading at similar levels as its fair value estimate
- Industry average of 23% suggests Fox-Wizel's peers are currently trading at a higher premium to fair value
How far off is Fox-Wizel Ltd. (TLV:FOX) from its intrinsic value? Using the most recent financial data, we'll take a look at whether the stock is fairly priced by taking the expected future cash flows and discounting them to today's value. We will use the Discounted Cash Flow (DCF) model on this occasion. It may sound complicated, but actually it is quite simple!
Remember though, that there are many ways to estimate a company's value, and a DCF is just one method. For those who are keen learners of equity analysis, the Simply Wall St analysis model here may be something of interest to you.
View our latest analysis for Fox-Wizel
The Calculation
We're using the 2-stage growth model, which simply means we take in account two stages of company's growth. In the initial period the company may have a higher growth rate and the second stage is usually assumed to have a stable growth rate. To start off with, we need to estimate the next ten years of cash flows. Seeing as no analyst estimates of free cash flow are available to us, we have extrapolate the previous free cash flow (FCF) from the company's last reported value. We assume companies with shrinking free cash flow will slow their rate of shrinkage, and that companies with growing free cash flow will see their growth rate slow, over this period. We do this to reflect that growth tends to slow more in the early years than it does in later years.
A DCF is all about the idea that a dollar in the future is less valuable than a dollar today, so we discount the value of these future cash flows to their estimated value in today's dollars:
10-year free cash flow (FCF) estimate
| 2024 | 2025 | 2026 | 2027 | 2028 | 2029 | 2030 | 2031 | 2032 | 2033 | |
| Levered FCF (₪, Millions) | ₪360.2m | ₪349.4m | ₪344.0m | ₪342.1m | ₪342.7m | ₪344.9m | ₪348.4m | ₪352.7m | ₪357.7m | ₪363.2m |
| Growth Rate Estimate Source | Est @ -5.06% | Est @ -3.00% | Est @ -1.56% | Est @ -0.55% | Est @ 0.16% | Est @ 0.66% | Est @ 1.00% | Est @ 1.24% | Est @ 1.41% | Est @ 1.53% |
| Present Value (₪, Millions) Discounted @ 11% | ₪325 | ₪284 | ₪252 | ₪226 | ₪204 | ₪185 | ₪168 | ₪153 | ₪140 | ₪128 |
("Est" = FCF growth rate estimated by Simply Wall St)
Present Value of 10-year Cash Flow (PVCF) = ₪2.1b
We now need to calculate the Terminal Value, which accounts for all the future cash flows after this ten year period. The Gordon Growth formula is used to calculate Terminal Value at a future annual growth rate equal to the 5-year average of the 10-year government bond yield of 1.8%. We discount the terminal cash flows to today's value at a cost of equity of 11%.
Terminal Value (TV)= FCF2033 × (1 + g) ÷ (r – g) = ₪363m× (1 + 1.8%) ÷ (11%– 1.8%) = ₪4.0b
Present Value of Terminal Value (PVTV)= TV / (1 + r)10= ₪4.0b÷ ( 1 + 11%)10= ₪1.4b
The total value, or equity value, is then the sum of the present value of the future cash flows, which in this case is ₪3.5b. In the final step we divide the equity value by the number of shares outstanding. Relative to the current share price of ₪273, the company appears around fair value at the time of writing. Valuations are imprecise instruments though, rather like a telescope - move a few degrees and end up in a different galaxy. Do keep this in mind.
The Assumptions
We would point out that the most important inputs to a discounted cash flow are the discount rate and of course the actual cash flows. Part of investing is coming up with your own evaluation of a company's future performance, so try the calculation yourself and check your own assumptions. The DCF also does not consider the possible cyclicality of an industry, or a company's future capital requirements, so it does not give a full picture of a company's potential performance. Given that we are looking at Fox-Wizel as potential shareholders, the cost of equity is used as the discount rate, rather than the cost of capital (or weighted average cost of capital, WACC) which accounts for debt. In this calculation we've used 11%, which is based on a levered beta of 1.508. Beta is a measure of a stock's volatility, compared to the market as a whole. We get our beta from the industry average beta of globally comparable companies, with an imposed limit between 0.8 and 2.0, which is a reasonable range for a stable business.
Next Steps:
Although the valuation of a company is important, it is only one of many factors that you need to assess for a company. DCF models are not the be-all and end-all of investment valuation. Instead the best use for a DCF model is to test certain assumptions and theories to see if they would lead to the company being undervalued or overvalued. For instance, if the terminal value growth rate is adjusted slightly, it can dramatically alter the overall result. For Fox-Wizel, there are three additional elements you should further examine:
- Risks: We feel that you should assess the 2 warning signs for Fox-Wizel we've flagged before making an investment in the company.
- Other High Quality Alternatives: Do you like a good all-rounder? Explore our interactive list of high quality stocks to get an idea of what else is out there you may be missing!
- Other Environmentally-Friendly Companies: Concerned about the environment and think consumers will buy eco-friendly products more and more? Browse through our interactive list of companies that are thinking about a greener future to discover some stocks you may not have thought of!
PS. Simply Wall St updates its DCF calculation for every Israeli stock every day, so if you want to find the intrinsic value of any other stock just search here.
Mobile Infrastructure for Defense and Disaster
The next wave in robotics isn't humanoid. Its fully autonomous towers delivering 5G, ISR, and radar in under 30 minutes, anywhere.
Get the investor briefing before the next round of contracts
Sponsored On Behalf of CiTechNew: AI Stock Screener & Alerts
Our new AI Stock Screener scans the market every day to uncover opportunities.
• Dividend Powerhouses (3%+ Yield)
• Undervalued Small Caps with Insider Buying
• High growth Tech and AI Companies
Or build your own from over 50 metrics.
Have feedback on this article? Concerned about the content? Get in touch with us directly. Alternatively, email editorial-team (at) simplywallst.com.
This article by Simply Wall St is general in nature. We provide commentary based on historical data and analyst forecasts only using an unbiased methodology and our articles are not intended to be financial advice. It does not constitute a recommendation to buy or sell any stock, and does not take account of your objectives, or your financial situation. We aim to bring you long-term focused analysis driven by fundamental data. Note that our analysis may not factor in the latest price-sensitive company announcements or qualitative material. Simply Wall St has no position in any stocks mentioned.
About TASE:FOX
Fox-Wizel
Designs, acquires, markets, and distributes clothing, fashion accessories, lingerie, footwear, fashion and sports accessories, home fashion, and baby and children's products in Israel, Canada, Europe, Asia, and internationally.
Mediocre balance sheet second-rate dividend payer.
Similar Companies
Market Insights

Weekly Picks

THE KINGDOM OF BROWN GOODS: WHY MGPI IS BEING CRUSHED BY INVENTORY & PRIMED FOR RESURRECTION


Why Vertical Aerospace (NYSE: EVTL) is Worth Possibly Over 13x its Current Price


The Quiet Giant That Became AI’s Power Grid
Recently Updated Narratives

Occidental Petroleum to Become Fairly Priced at $68.29 According to Future Projections

Agfa-Gevaert is a digital and materials turnaround opportunity, with growth potential in ZIRFON, but carrying legacy risks.

Hitit Bilgisayar Hizmetleri will achieve a 19.7% revenue boost in the next five years
Popular Narratives


MicroVision will explode future revenue by 380.37% with a vision towards success


Crazy Undervalued 42 Baggers Silver Play (Active & Running Mine)


