- Israel
- /
- Real Estate
- /
- TASE:DIMRI
The total return for Y.H. Dimri Construction & Development (TLV:DIMRI) investors has risen faster than earnings growth over the last five years

When you buy shares in a company, it's worth keeping in mind the possibility that it could fail, and you could lose your money. But on a lighter note, a good company can see its share price rise well over 100%. Long term Y.H. Dimri Construction & Development Ltd (TLV:DIMRI) shareholders would be well aware of this, since the stock is up 297% in five years. It's also up 13% in about a month. But this could be related to good market conditions -- stocks in its market are up 5.9% in the last month.
In light of the stock dropping 7.2% in the past week, we want to investigate the longer term story, and see if fundamentals have been the driver of the company's positive five-year return.
While markets are a powerful pricing mechanism, share prices reflect investor sentiment, not just underlying business performance. By comparing earnings per share (EPS) and share price changes over time, we can get a feel for how investor attitudes to a company have morphed over time.
Over half a decade, Y.H. Dimri Construction & Development managed to grow its earnings per share at 33% a year. That makes the EPS growth particularly close to the yearly share price growth of 32%. Therefore one could conclude that sentiment towards the shares hasn't morphed very much. In fact, the share price seems to largely reflect the EPS growth.
The image below shows how EPS has tracked over time (if you click on the image you can see greater detail).
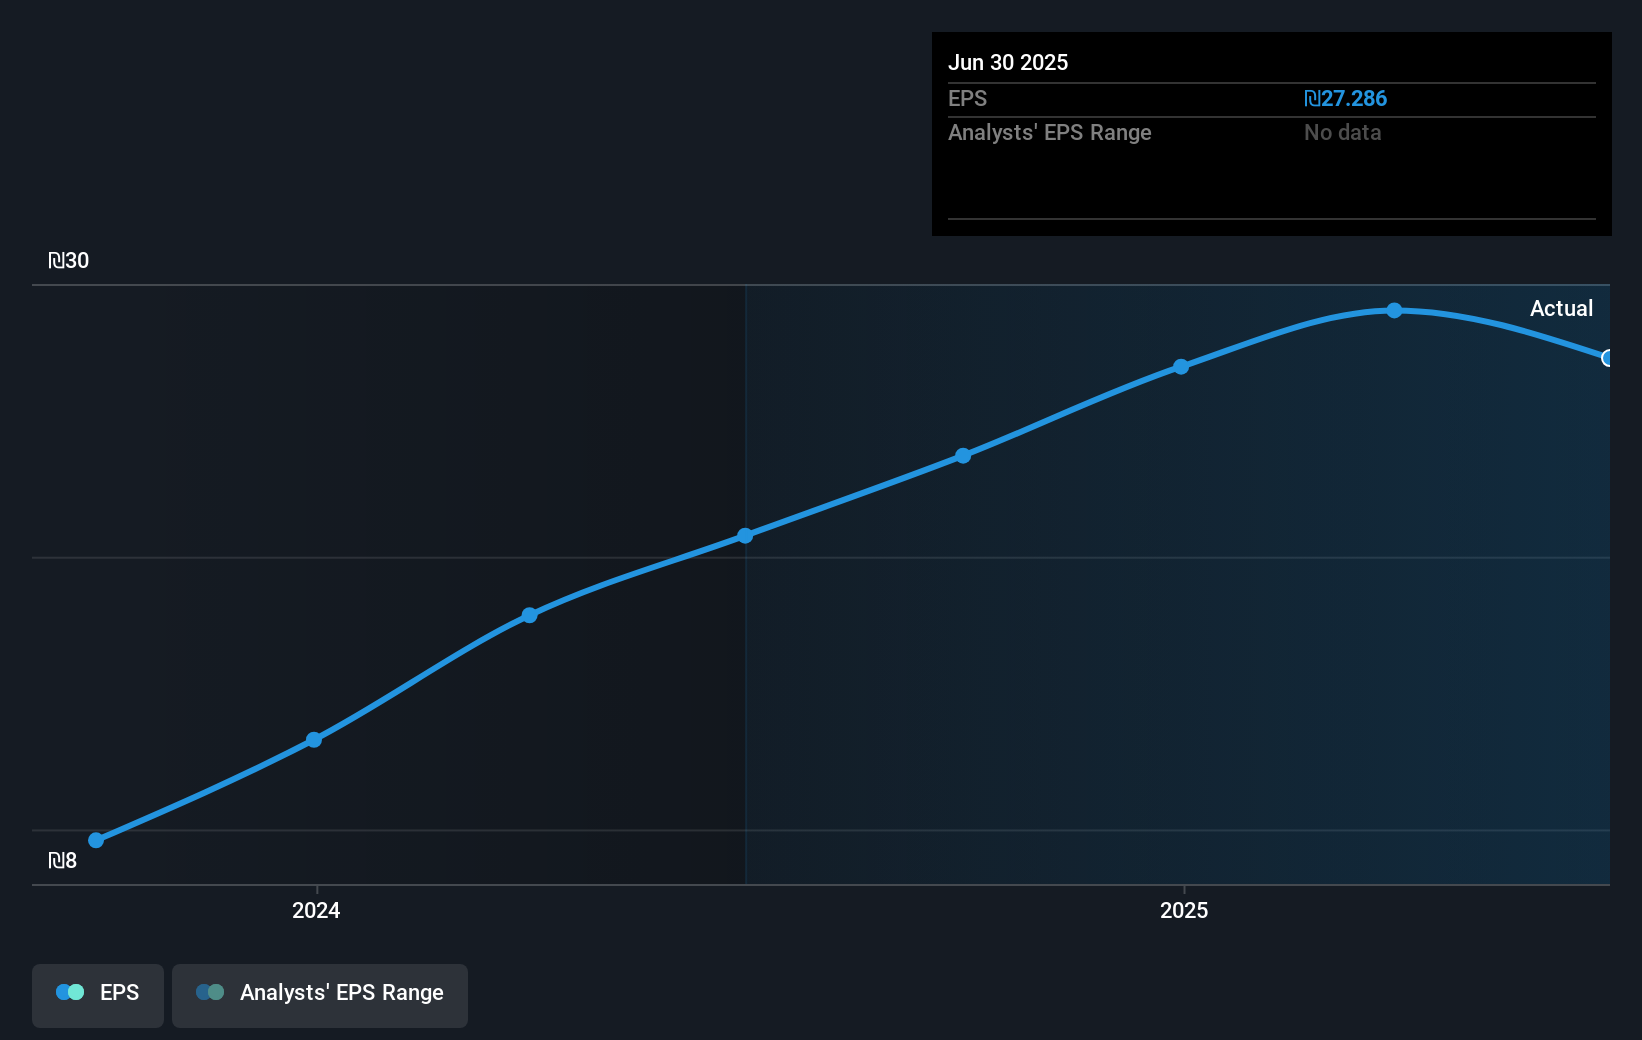
Dive deeper into Y.H. Dimri Construction & Development's key metrics by checking this interactive graph of Y.H. Dimri Construction & Development's earnings, revenue and cash flow.
What About Dividends?
It is important to consider the total shareholder return, as well as the share price return, for any given stock. The TSR is a return calculation that accounts for the value of cash dividends (assuming that any dividend received was reinvested) and the calculated value of any discounted capital raisings and spin-offs. Arguably, the TSR gives a more comprehensive picture of the return generated by a stock. In the case of Y.H. Dimri Construction & Development, it has a TSR of 340% for the last 5 years. That exceeds its share price return that we previously mentioned. And there's no prize for guessing that the dividend payments largely explain the divergence!
A Different Perspective
Y.H. Dimri Construction & Development shareholders gained a total return of 28% during the year. Unfortunately this falls short of the market return. If we look back over five years, the returns are even better, coming in at 35% per year for five years. It's quite possible the business continues to execute with prowess, even as the share price gains are slowing. I find it very interesting to look at share price over the long term as a proxy for business performance. But to truly gain insight, we need to consider other information, too. Even so, be aware that Y.H. Dimri Construction & Development is showing 3 warning signs in our investment analysis , and 2 of those shouldn't be ignored...
For those who like to find winning investments this free list of undervalued companies with recent insider purchasing, could be just the ticket.
Please note, the market returns quoted in this article reflect the market weighted average returns of stocks that currently trade on Israeli exchanges.
The New Payments ETF Is Live on NASDAQ:
Money is moving to real-time rails, and a newly listed ETF now gives investors direct exposure. Fast settlement. Institutional custody. Simple access.
Explore how this launch could reshape portfolios
Sponsored ContentNew: Manage All Your Stock Portfolios in One Place
We've created the ultimate portfolio companion for stock investors, and it's free.
• Connect an unlimited number of Portfolios and see your total in one currency
• Be alerted to new Warning Signs or Risks via email or mobile
• Track the Fair Value of your stocks
Have feedback on this article? Concerned about the content? Get in touch with us directly. Alternatively, email editorial-team (at) simplywallst.com.
This article by Simply Wall St is general in nature. We provide commentary based on historical data and analyst forecasts only using an unbiased methodology and our articles are not intended to be financial advice. It does not constitute a recommendation to buy or sell any stock, and does not take account of your objectives, or your financial situation. We aim to bring you long-term focused analysis driven by fundamental data. Note that our analysis may not factor in the latest price-sensitive company announcements or qualitative material. Simply Wall St has no position in any stocks mentioned.
About TASE:DIMRI
Y.H. Dimri Construction & Development
Engages in the real estate business in Israel, Romania, and the Czech Republic.
Proven track record with mediocre balance sheet.
Similar Companies
Market Insights

Weekly Picks

THE KINGDOM OF BROWN GOODS: WHY MGPI IS BEING CRUSHED BY INVENTORY & PRIMED FOR RESURRECTION


Why Vertical Aerospace (NYSE: EVTL) is Worth Possibly Over 13x its Current Price


The Quiet Giant That Became AI’s Power Grid
Recently Updated Narratives


MINISO's fair value is projected at 26.69 with an anticipated PE ratio shift of 20x

Fiverr International will transform the freelance industry with AI-powered growth

Stride Stock: Online Education Finds Its Second Act
Popular Narratives


MicroVision will explode future revenue by 380.37% with a vision towards success


Crazy Undervalued 42 Baggers Silver Play (Active & Running Mine)


