- Israel
- /
- Aerospace & Defense
- /
- TASE:ISI
Imagesat International (I.S.I) (TLV:ISI) Will Be Hoping To Turn Its Returns On Capital Around


What are the early trends we should look for to identify a stock that could multiply in value over the long term? Ideally, a business will show two trends; firstly a growing return on capital employed (ROCE) and secondly, an increasing amount of capital employed. This shows us that it's a compounding machine, able to continually reinvest its earnings back into the business and generate higher returns. Having said that, from a first glance at Imagesat International (I.S.I) (TLV:ISI) we aren't jumping out of our chairs at how returns are trending, but let's have a deeper look.
Return On Capital Employed (ROCE): What Is It?
Just to clarify if you're unsure, ROCE is a metric for evaluating how much pre-tax income (in percentage terms) a company earns on the capital invested in its business. Analysts use this formula to calculate it for Imagesat International (I.S.I):
Return on Capital Employed = Earnings Before Interest and Tax (EBIT) ÷ (Total Assets - Current Liabilities)
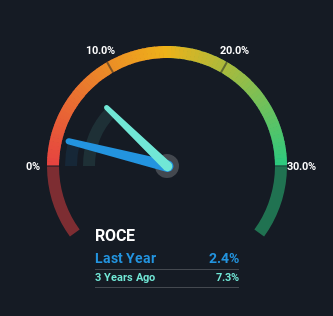
0.024 = US$5.0m ÷ (US$271m - US$59m) (Based on the trailing twelve months to June 2023).
So, Imagesat International (I.S.I) has an ROCE of 2.4%. In absolute terms, that's a low return and it also under-performs the Aerospace & Defense industry average of 11%.
View our latest analysis for Imagesat International (I.S.I)
Above you can see how the current ROCE for Imagesat International (I.S.I) compares to its prior returns on capital, but there's only so much you can tell from the past. If you'd like to see what analysts are forecasting going forward, you should check out our free report for Imagesat International (I.S.I).
What Does the ROCE Trend For Imagesat International (I.S.I) Tell Us?
On the surface, the trend of ROCE at Imagesat International (I.S.I) doesn't inspire confidence. To be more specific, ROCE has fallen from 7.3% over the last three years. And considering revenue has dropped while employing more capital, we'd be cautious. This could mean that the business is losing its competitive advantage or market share, because while more money is being put into ventures, it's actually producing a lower return - "less bang for their buck" per se.
While on the subject, we noticed that the ratio of current liabilities to total assets has risen to 22%, which has impacted the ROCE. If current liabilities hadn't increased as much as they did, the ROCE could actually be even lower. While the ratio isn't currently too high, it's worth keeping an eye on this because if it gets particularly high, the business could then face some new elements of risk.
The Key Takeaway
From the above analysis, we find it rather worrisome that returns on capital and sales for Imagesat International (I.S.I) have fallen, meanwhile the business is employing more capital than it was three years ago. Investors haven't taken kindly to these developments, since the stock has declined 41% from where it was year ago. That being the case, unless the underlying trends revert to a more positive trajectory, we'd consider looking elsewhere.
One more thing: We've identified 2 warning signs with Imagesat International (I.S.I) (at least 1 which is a bit unpleasant) , and understanding these would certainly be useful.
If you want to search for solid companies with great earnings, check out this free list of companies with good balance sheets and impressive returns on equity.
If you're looking to trade Imagesat International (I.S.I), open an account with the lowest-cost platform trusted by professionals, Interactive Brokers.
With clients in over 200 countries and territories, and access to 160 markets, IBKR lets you trade stocks, options, futures, forex, bonds and funds from a single integrated account.
Enjoy no hidden fees, no account minimums, and FX conversion rates as low as 0.03%, far better than what most brokers offer.
Sponsored ContentNew: AI Stock Screener & Alerts
Our new AI Stock Screener scans the market every day to uncover opportunities.
• Dividend Powerhouses (3%+ Yield)
• Undervalued Small Caps with Insider Buying
• High growth Tech and AI Companies
Or build your own from over 50 metrics.
Have feedback on this article? Concerned about the content? Get in touch with us directly. Alternatively, email editorial-team (at) simplywallst.com.
This article by Simply Wall St is general in nature. We provide commentary based on historical data and analyst forecasts only using an unbiased methodology and our articles are not intended to be financial advice. It does not constitute a recommendation to buy or sell any stock, and does not take account of your objectives, or your financial situation. We aim to bring you long-term focused analysis driven by fundamental data. Note that our analysis may not factor in the latest price-sensitive company announcements or qualitative material. Simply Wall St has no position in any stocks mentioned.
About TASE:ISI
Imagesat International (I.S.I)
Provides space-based intelligence, satellite imagery, and data analytics solutions for homeland defense markets and civilian markets worldwide.
High growth potential and good value.
Similar Companies
Market Insights

Community Narratives


