- Hong Kong
- /
- Marine and Shipping
- /
- SEHK:1748
Xin Yuan Enterprises Group (HKG:1748) sheds 12% this week, as yearly returns fall more in line with earnings growth


Xin Yuan Enterprises Group Limited (HKG:1748) shareholders might be concerned after seeing the share price drop 30% in the last month. But in stark contrast, the returns over the last half decade have impressed. It's fair to say most would be happy with 164% the gain in that time. We think it's more important to dwell on the long term returns than the short term returns. Only time will tell if there is still too much optimism currently reflected in the share price.
Although Xin Yuan Enterprises Group has shed HK$224m from its market cap this week, let's take a look at its longer term fundamental trends and see if they've driven returns.
See our latest analysis for Xin Yuan Enterprises Group
There is no denying that markets are sometimes efficient, but prices do not always reflect underlying business performance. One flawed but reasonable way to assess how sentiment around a company has changed is to compare the earnings per share (EPS) with the share price.
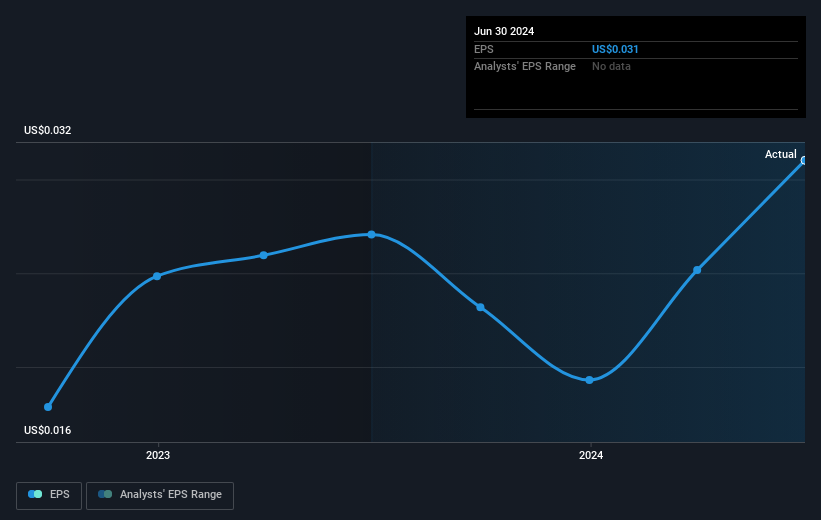
Over half a decade, Xin Yuan Enterprises Group managed to grow its earnings per share at 18% a year. This EPS growth is reasonably close to the 21% average annual increase in the share price. That suggests that the market sentiment around the company hasn't changed much over that time. In fact, the share price seems to largely reflect the EPS growth.
The image below shows how EPS has tracked over time (if you click on the image you can see greater detail).
We like that insiders have been buying shares in the last twelve months. Even so, future earnings will be far more important to whether current shareholders make money. It might be well worthwhile taking a look at our free report on Xin Yuan Enterprises Group's earnings, revenue and cash flow.
What About The Total Shareholder Return (TSR)?
We've already covered Xin Yuan Enterprises Group's share price action, but we should also mention its total shareholder return (TSR). The TSR is a return calculation that accounts for the value of cash dividends (assuming that any dividend received was reinvested) and the calculated value of any discounted capital raisings and spin-offs. Xin Yuan Enterprises Group hasn't been paying dividends, but its TSR of 196% exceeds its share price return of 164%, implying it has either spun-off a business, or raised capital at a discount; thereby providing additional value to shareholders.
A Different Perspective
It's nice to see that Xin Yuan Enterprises Group shareholders have received a total shareholder return of 57% over the last year. Since the one-year TSR is better than the five-year TSR (the latter coming in at 24% per year), it would seem that the stock's performance has improved in recent times. Someone with an optimistic perspective could view the recent improvement in TSR as indicating that the business itself is getting better with time. While it is well worth considering the different impacts that market conditions can have on the share price, there are other factors that are even more important. For instance, we've identified 1 warning sign for Xin Yuan Enterprises Group that you should be aware of.
There are plenty of other companies that have insiders buying up shares. You probably do not want to miss this free list of undervalued small cap companies that insiders are buying.
Please note, the market returns quoted in this article reflect the market weighted average returns of stocks that currently trade on Hong Kong exchanges.
New: AI Stock Screener & Alerts
Our new AI Stock Screener scans the market every day to uncover opportunities.
• Dividend Powerhouses (3%+ Yield)
• Undervalued Small Caps with Insider Buying
• High growth Tech and AI Companies
Or build your own from over 50 metrics.
Have feedback on this article? Concerned about the content? Get in touch with us directly. Alternatively, email editorial-team (at) simplywallst.com.
This article by Simply Wall St is general in nature. We provide commentary based on historical data and analyst forecasts only using an unbiased methodology and our articles are not intended to be financial advice. It does not constitute a recommendation to buy or sell any stock, and does not take account of your objectives, or your financial situation. We aim to bring you long-term focused analysis driven by fundamental data. Note that our analysis may not factor in the latest price-sensitive company announcements or qualitative material. Simply Wall St has no position in any stocks mentioned.
About SEHK:1748
Xin Yuan Enterprises Group
An investment holding company, provides asphalt tanker and bulk carrier chartering services in the People’s Republic of China, Hong Kong, and Singapore.
Flawless balance sheet and good value.
