IRICO Group New Energy (HKG:438) Will Be Hoping To Turn Its Returns On Capital Around

Finding a business that has the potential to grow substantially is not easy, but it is possible if we look at a few key financial metrics. Ideally, a business will show two trends; firstly a growing return on capital employed (ROCE) and secondly, an increasing amount of capital employed. Ultimately, this demonstrates that it's a business that is reinvesting profits at increasing rates of return. However, after briefly looking over the numbers, we don't think IRICO Group New Energy (HKG:438) has the makings of a multi-bagger going forward, but let's have a look at why that may be.
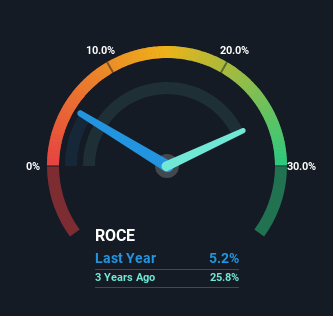
What Is Return On Capital Employed (ROCE)?
If you haven't worked with ROCE before, it measures the 'return' (pre-tax profit) a company generates from capital employed in its business. To calculate this metric for IRICO Group New Energy, this is the formula:
Return on Capital Employed = Earnings Before Interest and Tax (EBIT) ÷ (Total Assets - Current Liabilities)
0.052 = CN¥156m ÷ (CN¥6.4b - CN¥3.4b) (Based on the trailing twelve months to December 2022).
So, IRICO Group New Energy has an ROCE of 5.2%. Ultimately, that's a low return and it under-performs the Electronic industry average of 7.5%.
View our latest analysis for IRICO Group New Energy
While the past is not representative of the future, it can be helpful to know how a company has performed historically, which is why we have this chart above. If you'd like to look at how IRICO Group New Energy has performed in the past in other metrics, you can view this free graph of past earnings, revenue and cash flow.
What Can We Tell From IRICO Group New Energy's ROCE Trend?
When we looked at the ROCE trend at IRICO Group New Energy, we didn't gain much confidence. Over the last five years, returns on capital have decreased to 5.2% from 19% five years ago. Although, given both revenue and the amount of assets employed in the business have increased, it could suggest the company is investing in growth, and the extra capital has led to a short-term reduction in ROCE. If these investments prove successful, this can bode very well for long term stock performance.
On a side note, IRICO Group New Energy has done well to pay down its current liabilities to 53% of total assets. So we could link some of this to the decrease in ROCE. Effectively this means their suppliers or short-term creditors are funding less of the business, which reduces some elements of risk. Since the business is basically funding more of its operations with it's own money, you could argue this has made the business less efficient at generating ROCE. Either way, they're still at a pretty high level, so we'd like to see them fall further if possible.
The Bottom Line On IRICO Group New Energy's ROCE
Even though returns on capital have fallen in the short term, we find it promising that revenue and capital employed have both increased for IRICO Group New Energy. And there could be an opportunity here if other metrics look good too, because the stock has declined 54% in the last five years. As a result, we'd recommend researching this stock further to uncover what other fundamentals of the business can show us.
One more thing: We've identified 3 warning signs with IRICO Group New Energy (at least 2 which are a bit unpleasant) , and understanding them would certainly be useful.
While IRICO Group New Energy isn't earning the highest return, check out this free list of companies that are earning high returns on equity with solid balance sheets.
Mobile Infrastructure for Defense and Disaster
The next wave in robotics isn't humanoid. Its fully autonomous towers delivering 5G, ISR, and radar in under 30 minutes, anywhere.
Get the investor briefing before the next round of contracts
Sponsored On Behalf of CiTechNew: AI Stock Screener & Alerts
Our new AI Stock Screener scans the market every day to uncover opportunities.
• Dividend Powerhouses (3%+ Yield)
• Undervalued Small Caps with Insider Buying
• High growth Tech and AI Companies
Or build your own from over 50 metrics.
Have feedback on this article? Concerned about the content? Get in touch with us directly. Alternatively, email editorial-team (at) simplywallst.com.
This article by Simply Wall St is general in nature. We provide commentary based on historical data and analyst forecasts only using an unbiased methodology and our articles are not intended to be financial advice. It does not constitute a recommendation to buy or sell any stock, and does not take account of your objectives, or your financial situation. We aim to bring you long-term focused analysis driven by fundamental data. Note that our analysis may not factor in the latest price-sensitive company announcements or qualitative material. Simply Wall St has no position in any stocks mentioned.
About SEHK:438
IRICO Group New Energy
Engages in the research and development, manufacturing, and sale of solar photovoltaic glass in the People’s Republic of China and internationally.
Low risk and slightly overvalued.
Market Insights

Weekly Picks

THE KINGDOM OF BROWN GOODS: WHY MGPI IS BEING CRUSHED BY INVENTORY & PRIMED FOR RESURRECTION


Why Vertical Aerospace (NYSE: EVTL) is Worth Possibly Over 13x its Current Price


The Quiet Giant That Became AI’s Power Grid
Recently Updated Narratives


A case for USD $14.81 per share based on book value. Be warned, this is a micro-cap dependent on a single mine.

Occidental Petroleum to Become Fairly Priced at $68.29 According to Future Projections

Agfa-Gevaert is a digital and materials turnaround opportunity, with growth potential in ZIRFON, but carrying legacy risks.
Popular Narratives


MicroVision will explode future revenue by 380.37% with a vision towards success


Crazy Undervalued 42 Baggers Silver Play (Active & Running Mine)


