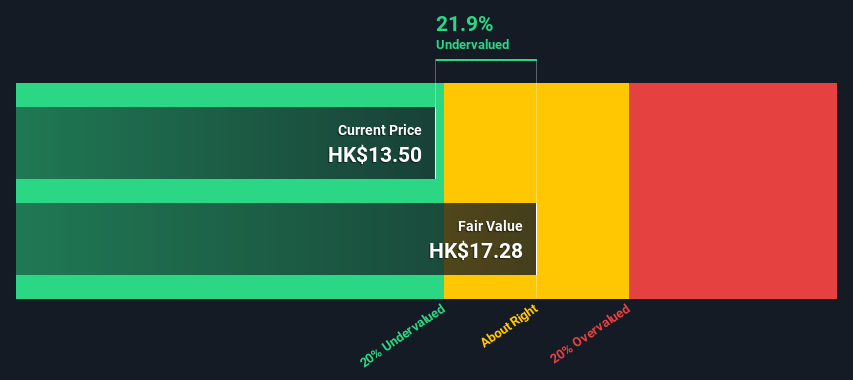
An Intrinsic Calculation For Asiainfo Technologies Limited (HKG:1675) Suggests It's 22% Undervalued

Today we'll do a simple run through of a valuation method used to estimate the attractiveness of Asiainfo Technologies Limited (HKG:1675) as an investment opportunity by taking the expected future cash flows and discounting them to today's value. Our analysis will employ the Discounted Cash Flow (DCF) model. Don't get put off by the jargon, the math behind it is actually quite straightforward.
Companies can be valued in a lot of ways, so we would point out that a DCF is not perfect for every situation. If you still have some burning questions about this type of valuation, take a look at the Simply Wall St analysis model.
See our latest analysis for Asiainfo Technologies
The method
We use what is known as a 2-stage model, which simply means we have two different periods of growth rates for the company's cash flows. Generally the first stage is higher growth, and the second stage is a lower growth phase. To start off with, we need to estimate the next ten years of cash flows. Seeing as no analyst estimates of free cash flow are available to us, we have extrapolate the previous free cash flow (FCF) from the company's last reported value. We assume companies with shrinking free cash flow will slow their rate of shrinkage, and that companies with growing free cash flow will see their growth rate slow, over this period. We do this to reflect that growth tends to slow more in the early years than it does in later years.
Generally we assume that a dollar today is more valuable than a dollar in the future, so we discount the value of these future cash flows to their estimated value in today's dollars:
10-year free cash flow (FCF) estimate
| 2022 | 2023 | 2024 | 2025 | 2026 | 2027 | 2028 | 2029 | 2030 | 2031 | |
| Levered FCF (CN¥, Millions) | CN¥662.0m | CN¥661.8m | CN¥664.7m | CN¥669.6m | CN¥676.0m | CN¥683.6m | CN¥692.0m | CN¥701.0m | CN¥710.5m | CN¥720.4m |
| Growth Rate Estimate Source | Est @ -0.67% | Est @ -0.03% | Est @ 0.43% | Est @ 0.74% | Est @ 0.96% | Est @ 1.12% | Est @ 1.23% | Est @ 1.3% | Est @ 1.36% | Est @ 1.39% |
| Present Value (CN¥, Millions) Discounted @ 6.3% | CN¥623 | CN¥585 | CN¥553 | CN¥523 | CN¥497 | CN¥473 | CN¥450 | CN¥428 | CN¥408 | CN¥389 |
("Est" = FCF growth rate estimated by Simply Wall St)
Present Value of 10-year Cash Flow (PVCF) = CN¥4.9b
We now need to calculate the Terminal Value, which accounts for all the future cash flows after this ten year period. For a number of reasons a very conservative growth rate is used that cannot exceed that of a country's GDP growth. In this case we have used the 5-year average of the 10-year government bond yield (1.5%) to estimate future growth. In the same way as with the 10-year 'growth' period, we discount future cash flows to today's value, using a cost of equity of 6.3%.
Terminal Value (TV)= FCF2031 × (1 + g) ÷ (r – g) = CN¥720m× (1 + 1.5%) ÷ (6.3%– 1.5%) = CN¥15b
Present Value of Terminal Value (PVTV)= TV / (1 + r)10= CN¥15b÷ ( 1 + 6.3%)10= CN¥8.1b
The total value, or equity value, is then the sum of the present value of the future cash flows, which in this case is CN¥13b. To get the intrinsic value per share, we divide this by the total number of shares outstanding. Compared to the current share price of HK$13.5, the company appears a touch undervalued at a 22% discount to where the stock price trades currently. Valuations are imprecise instruments though, rather like a telescope - move a few degrees and end up in a different galaxy. Do keep this in mind.
Important assumptions
Now the most important inputs to a discounted cash flow are the discount rate, and of course, the actual cash flows. Part of investing is coming up with your own evaluation of a company's future performance, so try the calculation yourself and check your own assumptions. The DCF also does not consider the possible cyclicality of an industry, or a company's future capital requirements, so it does not give a full picture of a company's potential performance. Given that we are looking at Asiainfo Technologies as potential shareholders, the cost of equity is used as the discount rate, rather than the cost of capital (or weighted average cost of capital, WACC) which accounts for debt. In this calculation we've used 6.3%, which is based on a levered beta of 0.980. Beta is a measure of a stock's volatility, compared to the market as a whole. We get our beta from the industry average beta of globally comparable companies, with an imposed limit between 0.8 and 2.0, which is a reasonable range for a stable business.
Looking Ahead:
Although the valuation of a company is important, it shouldn't be the only metric you look at when researching a company. The DCF model is not a perfect stock valuation tool. Rather it should be seen as a guide to "what assumptions need to be true for this stock to be under/overvalued?" For instance, if the terminal value growth rate is adjusted slightly, it can dramatically alter the overall result. Why is the intrinsic value higher than the current share price? For Asiainfo Technologies, we've compiled three additional aspects you should explore:
- Risks: For instance, we've identified 1 warning sign for Asiainfo Technologies that you should be aware of.
- Future Earnings: How does 1675's growth rate compare to its peers and the wider market? Dig deeper into the analyst consensus number for the upcoming years by interacting with our free analyst growth expectation chart.
- Other High Quality Alternatives: Do you like a good all-rounder? Explore our interactive list of high quality stocks to get an idea of what else is out there you may be missing!
PS. Simply Wall St updates its DCF calculation for every Hong Kong stock every day, so if you want to find the intrinsic value of any other stock just search here.
Mobile Infrastructure for Defense and Disaster
The next wave in robotics isn't humanoid. Its fully autonomous towers delivering 5G, ISR, and radar in under 30 minutes, anywhere.
Get the investor briefing before the next round of contracts
Sponsored On Behalf of CiTechNew: Manage All Your Stock Portfolios in One Place
We've created the ultimate portfolio companion for stock investors, and it's free.
• Connect an unlimited number of Portfolios and see your total in one currency
• Be alerted to new Warning Signs or Risks via email or mobile
• Track the Fair Value of your stocks
Have feedback on this article? Concerned about the content? Get in touch with us directly. Alternatively, email editorial-team (at) simplywallst.com.
This article by Simply Wall St is general in nature. We provide commentary based on historical data and analyst forecasts only using an unbiased methodology and our articles are not intended to be financial advice. It does not constitute a recommendation to buy or sell any stock, and does not take account of your objectives, or your financial situation. We aim to bring you long-term focused analysis driven by fundamental data. Note that our analysis may not factor in the latest price-sensitive company announcements or qualitative material. Simply Wall St has no position in any stocks mentioned.
About SEHK:1675
AsiaInfo Technologies
An investment holding company, offers telecom software products and related services in the People’s Republic of China.
Flawless balance sheet and good value.
Similar Companies
Market Insights

Weekly Picks

THE KINGDOM OF BROWN GOODS: WHY MGPI IS BEING CRUSHED BY INVENTORY & PRIMED FOR RESURRECTION


Why Vertical Aerospace (NYSE: EVTL) is Worth Possibly Over 13x its Current Price


The Quiet Giant That Became AI’s Power Grid
Recently Updated Narratives


A case for USD $14.81 per share based on book value. Be warned, this is a micro-cap dependent on a single mine.

Occidental Petroleum to Become Fairly Priced at $68.29 According to Future Projections

Agfa-Gevaert is a digital and materials turnaround opportunity, with growth potential in ZIRFON, but carrying legacy risks.
Popular Narratives


MicroVision will explode future revenue by 380.37% with a vision towards success


Crazy Undervalued 42 Baggers Silver Play (Active & Running Mine)


