
Advertisement
Yunfeng Financial Group Full Year 2024 Earnings: EPS: HK$0.12 (vs HK$0.10 in FY 2023)

Yunfeng Financial Group (HKG:376) Full Year 2024 Results
Key Financial Results
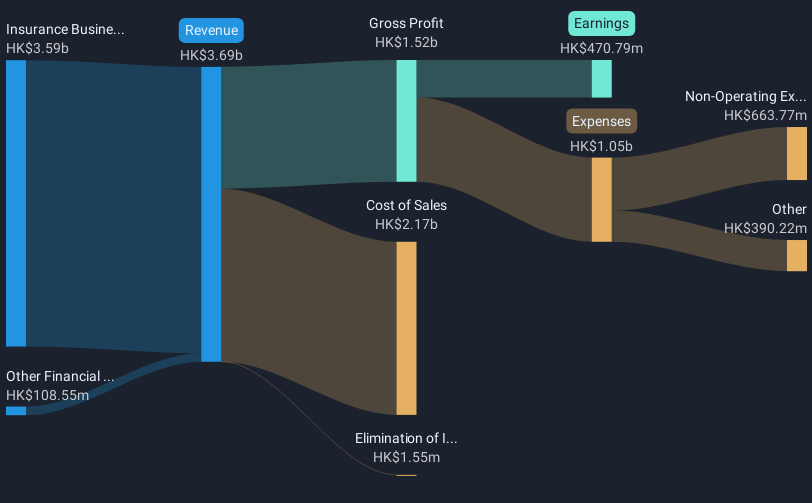
- Revenue: HK$3.69b (up 5.2% from FY 2023).
- Net income: HK$470.8m (up 19% from FY 2023).
- Profit margin: 13% (up from 11% in FY 2023). The increase in margin was driven by higher revenue.
- EPS: HK$0.12 (up from HK$0.10 in FY 2023).
All figures shown in the chart above are for the trailing 12 month (TTM) period
The primary driver behind last 12 months revenue was the Insurance Business segment contributing a total revenue of HK$3.59b (97% of total revenue). Notably, cost of sales worth HK$2.17b amounted to 59% of total revenue thereby underscoring the impact on earnings. The most substantial expense, totaling HK$663.8m were related to Non-Operating costs. This indicates that a significant portion of the company's costs is related to non-core activities. Explore how 376's revenue and expenses shape its earnings.
Yunfeng Financial Group shares are down 4.1% from a week ago.
Risk Analysis
We should say that we've discovered 1 warning sign for Yunfeng Financial Group that you should be aware of before investing here.
New: Manage All Your Stock Portfolios in One Place
We've created the ultimate portfolio companion for stock investors, and it's free.
• Connect an unlimited number of Portfolios and see your total in one currency
• Be alerted to new Warning Signs or Risks via email or mobile
• Track the Fair Value of your stocks
Have feedback on this article? Concerned about the content? Get in touch with us directly. Alternatively, email editorial-team (at) simplywallst.com.
This article by Simply Wall St is general in nature. We provide commentary based on historical data and analyst forecasts only using an unbiased methodology and our articles are not intended to be financial advice. It does not constitute a recommendation to buy or sell any stock, and does not take account of your objectives, or your financial situation. We aim to bring you long-term focused analysis driven by fundamental data. Note that our analysis may not factor in the latest price-sensitive company announcements or qualitative material. Simply Wall St has no position in any stocks mentioned.
About SEHK:376
Yunfeng Financial Group
An investment holding company, engages in the provision of insurance products in Hong Kong and Macau.
Excellent balance sheet with acceptable track record.
Market Insights

Advertisement
Community Narratives
RIO is poised to weather a depressed iron ore environment, but commodity diversification comes with lower margins
Fair Value AU$110.51|4.1% overvalued
DU
Community Contributor
The demand for personalized medicine will keep Thermo Fisher Scientific thriving
Fair Value US$540.27|21.5% undervalued
UN
Community Contributor
Silver Play by A Family with 10x Potential
Fair Value UK£24.00|88.8% undervalued
RO
Community Contributor