
Advertisement
Those who invested in Uni-President China Holdings (HKG:220) a year ago are up 57%

These days it's easy to simply buy an index fund, and your returns should (roughly) match the market. But one can do better than that by picking better than average stocks (as part of a diversified portfolio). To wit, the Uni-President China Holdings Ltd (HKG:220) share price is 46% higher than it was a year ago, much better than the market return of around 15% (not including dividends) in the same period. So that should have shareholders smiling. Having said that, the longer term returns aren't so impressive, with stock gaining just 12% in three years.
Now it's worth having a look at the company's fundamentals too, because that will help us determine if the long term shareholder return has matched the performance of the underlying business.
View our latest analysis for Uni-President China Holdings
There is no denying that markets are sometimes efficient, but prices do not always reflect underlying business performance. One flawed but reasonable way to assess how sentiment around a company has changed is to compare the earnings per share (EPS) with the share price.
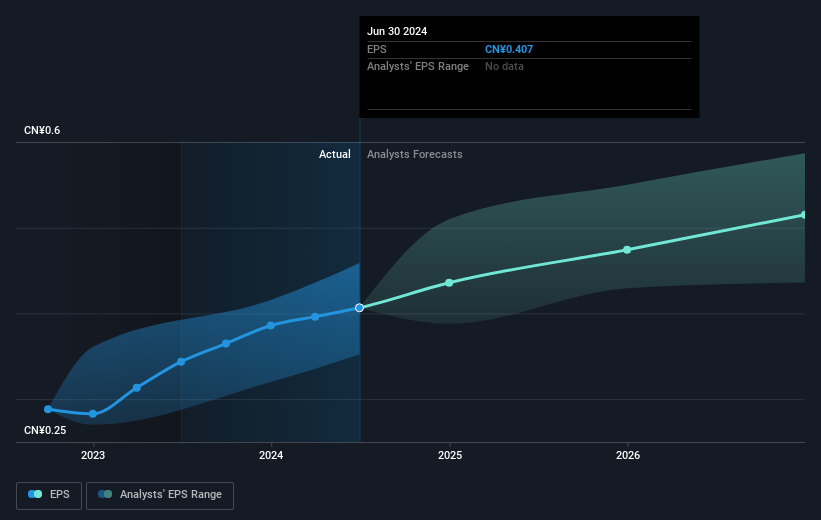
During the last year Uni-President China Holdings grew its earnings per share (EPS) by 18%. The share price gain of 46% certainly outpaced the EPS growth. So it's fair to assume the market has a higher opinion of the business than it a year ago.
The company's earnings per share (over time) is depicted in the image below (click to see the exact numbers).
We like that insiders have been buying shares in the last twelve months. Even so, future earnings will be far more important to whether current shareholders make money. Dive deeper into the earnings by checking this interactive graph of Uni-President China Holdings' earnings, revenue and cash flow.
What About Dividends?
As well as measuring the share price return, investors should also consider the total shareholder return (TSR). The TSR is a return calculation that accounts for the value of cash dividends (assuming that any dividend received was reinvested) and the calculated value of any discounted capital raisings and spin-offs. Arguably, the TSR gives a more comprehensive picture of the return generated by a stock. As it happens, Uni-President China Holdings' TSR for the last 1 year was 57%, which exceeds the share price return mentioned earlier. And there's no prize for guessing that the dividend payments largely explain the divergence!
A Different Perspective
It's good to see that Uni-President China Holdings has rewarded shareholders with a total shareholder return of 57% in the last twelve months. Of course, that includes the dividend. That's better than the annualised return of 5% over half a decade, implying that the company is doing better recently. Given the share price momentum remains strong, it might be worth taking a closer look at the stock, lest you miss an opportunity. I find it very interesting to look at share price over the long term as a proxy for business performance. But to truly gain insight, we need to consider other information, too. Take risks, for example - Uni-President China Holdings has 2 warning signs we think you should be aware of.
Uni-President China Holdings is not the only stock insiders are buying. So take a peek at this free list of small cap companies at attractive valuations which insiders have been buying.
Please note, the market returns quoted in this article reflect the market weighted average returns of stocks that currently trade on Hong Kong exchanges.
New: AI Stock Screener & Alerts
Our new AI Stock Screener scans the market every day to uncover opportunities.
• Dividend Powerhouses (3%+ Yield)
• Undervalued Small Caps with Insider Buying
• High growth Tech and AI Companies
Or build your own from over 50 metrics.
Have feedback on this article? Concerned about the content? Get in touch with us directly. Alternatively, email editorial-team (at) simplywallst.com.
This article by Simply Wall St is general in nature. We provide commentary based on historical data and analyst forecasts only using an unbiased methodology and our articles are not intended to be financial advice. It does not constitute a recommendation to buy or sell any stock, and does not take account of your objectives, or your financial situation. We aim to bring you long-term focused analysis driven by fundamental data. Note that our analysis may not factor in the latest price-sensitive company announcements or qualitative material. Simply Wall St has no position in any stocks mentioned.
About SEHK:220
Uni-President China Holdings
An investment holding company, manufactures, sells, and trades in beverages and food in the People’s Republic of China.
Excellent balance sheet with proven track record.
Market Insights


Advertisement
Community Narratives

Quality Assets, Cautious Expansion and Commodity Super-cycle To Deliver Steady Revenue Growth 
Fair Value US$20.44|5.2% undervalued
ST
Equity Analyst and Writer
Tullow Oil's Share Price Could Soar Up to 135% if Oil Holds at $70
Fair Value UK£0.45|64.0% undervalued
OI
Community Contributor