
Advertisement
- Hong Kong
- /
- Hospitality
- /
- SEHK:703
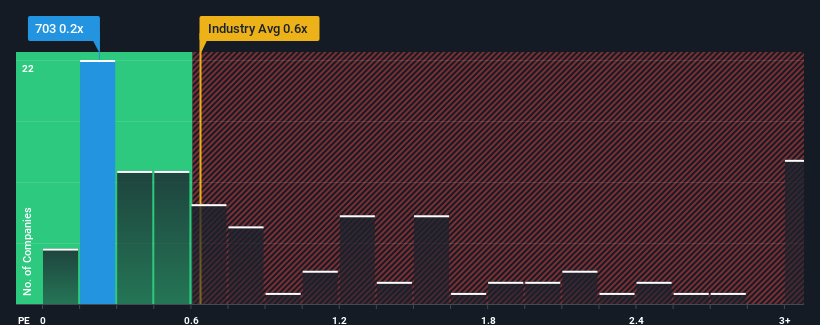
More Unpleasant Surprises Could Be In Store For Future Bright Holdings Limited's (HKG:703) Shares After Tumbling 26%
Unfortunately for some shareholders, the Future Bright Holdings Limited (HKG:703) share price has dived 26% in the last thirty days, prolonging recent pain. The drop over the last 30 days has capped off a tough year for shareholders, with the share price down 36% in that time.
In spite of the heavy fall in price, you could still be forgiven for feeling indifferent about Future Bright Holdings' P/S ratio of 0.2x, since the median price-to-sales (or "P/S") ratio for the Hospitality industry in Hong Kong is also close to 0.6x. However, investors might be overlooking a clear opportunity or potential setback if there is no rational basis for the P/S.
Check out our latest analysis for Future Bright Holdings
What Does Future Bright Holdings' Recent Performance Look Like?
With revenue growth that's exceedingly strong of late, Future Bright Holdings has been doing very well. Perhaps the market is expecting future revenue performance to taper off, which has kept the P/S from rising. If that doesn't eventuate, then existing shareholders have reason to be feeling optimistic about the future direction of the share price.
Want the full picture on earnings, revenue and cash flow for the company? Then our free report on Future Bright Holdings will help you shine a light on its historical performance.What Are Revenue Growth Metrics Telling Us About The P/S?
The only time you'd be comfortable seeing a P/S like Future Bright Holdings' is when the company's growth is tracking the industry closely.
Taking a look back first, we see that the company grew revenue by an impressive 72% last year. The latest three year period has also seen a 17% overall rise in revenue, aided extensively by its short-term performance. Accordingly, shareholders would have probably been satisfied with the medium-term rates of revenue growth.
This is in contrast to the rest of the industry, which is expected to grow by 19% over the next year, materially higher than the company's recent medium-term annualised growth rates.
In light of this, it's curious that Future Bright Holdings' P/S sits in line with the majority of other companies. Apparently many investors in the company are less bearish than recent times would indicate and aren't willing to let go of their stock right now. They may be setting themselves up for future disappointment if the P/S falls to levels more in line with recent growth rates.
What We Can Learn From Future Bright Holdings' P/S?
Following Future Bright Holdings' share price tumble, its P/S is just clinging on to the industry median P/S. While the price-to-sales ratio shouldn't be the defining factor in whether you buy a stock or not, it's quite a capable barometer of revenue expectations.
Our examination of Future Bright Holdings revealed its poor three-year revenue trends aren't resulting in a lower P/S as per our expectations, given they look worse than current industry outlook. Right now we are uncomfortable with the P/S as this revenue performance isn't likely to support a more positive sentiment for long. Unless the recent medium-term conditions improve, it's hard to accept the current share price as fair value.
Before you take the next step, you should know about the 2 warning signs for Future Bright Holdings that we have uncovered.
If these risks are making you reconsider your opinion on Future Bright Holdings, explore our interactive list of high quality stocks to get an idea of what else is out there.
New: AI Stock Screener & Alerts
Our new AI Stock Screener scans the market every day to uncover opportunities.
• Dividend Powerhouses (3%+ Yield)
• Undervalued Small Caps with Insider Buying
• High growth Tech and AI Companies
Or build your own from over 50 metrics.
Have feedback on this article? Concerned about the content? Get in touch with us directly. Alternatively, email editorial-team (at) simplywallst.com.
This article by Simply Wall St is general in nature. We provide commentary based on historical data and analyst forecasts only using an unbiased methodology and our articles are not intended to be financial advice. It does not constitute a recommendation to buy or sell any stock, and does not take account of your objectives, or your financial situation. We aim to bring you long-term focused analysis driven by fundamental data. Note that our analysis may not factor in the latest price-sensitive company announcements or qualitative material. Simply Wall St has no position in any stocks mentioned.
About SEHK:703
Future Bright Holdings
An investment holding company, engages in the operation of restaurants, catering, and food souvenir businesses in Hong Kong, Macau, and Mainland China.
Good value with slight risk.
Market Insights

Advertisement
Community Narratives
MicroVision will explode future revenue by 380.37% with a vision towards success
Fair Value US$60|98.4% undervalued
TH
Community Contributor
The Indispensable Artery for a New North American Economy
Fair Value CA$132.87|1.6% undervalued
TI
Community Contributor
Recently Updated Narratives
BE


Bejgal on MINISO Group Holding ·
MINISO's fair value is projected at 26.69 with an anticipated PE ratio shift of 20x
Fair Value:US$26.6928.0% undervalued
44 followersusers have followed this narrative
3 commentsusers have commented on this narrative
0 likesusers have liked this narrative
TI


TickerTickle on Oracle ·
The Quiet Giant That Became AI’s Power Grid
Fair Value:US$389.8149.5% undervalued
7 followersusers have followed this narrative
0 commentsusers have commented on this narrative
0 likesusers have liked this narrative
AU

AuCA on Nova Ljubljanska Banka d.d ·
Nova Ljubljanska Banka d.d will expect a 11.2% revenue boost driving future growth
Fair Value:€20916.3% undervalued
23 followersusers have followed this narrative
3 commentsusers have commented on this narrative
0 likesusers have liked this narrative
Popular Narratives
OS


oscargarcia on Alphabet ·
The company that turned a verb into a global necessity and basically runs the modern internet, digital ads, smartphones, maps, and AI.
Fair Value:US$3404.9% undervalued
134 followersusers have followed this narrative
6 commentsusers have commented on this narrative
18 likesusers have liked this narrative
TH

TheWallstreetKing on MicroVision ·
MicroVision will explode future revenue by 380.37% with a vision towards success
Fair Value:US$6098.4% undervalued
83 followersusers have followed this narrative
10 commentsusers have commented on this narrative
18 likesusers have liked this narrative
AN


AnalystConsensusTarget on NVIDIA ·
NVDA: Expanding AI Demand Will Drive Major Data Center Investments Through 2026
Fair Value:US$232.7923.6% undervalued
919 followersusers have followed this narrative
5 commentsusers have commented on this narrative
21 likesusers have liked this narrative