- Hong Kong
- /
- Construction
- /
- SEHK:1693
BGMC International Limited (HKG:1693) May Have Run Too Fast Too Soon With Recent 26% Price Plummet

Unfortunately for some shareholders, the BGMC International Limited (HKG:1693) share price has dived 26% in the last thirty days, prolonging recent pain. The drop over the last 30 days has capped off a tough year for shareholders, with the share price down 45% in that time.
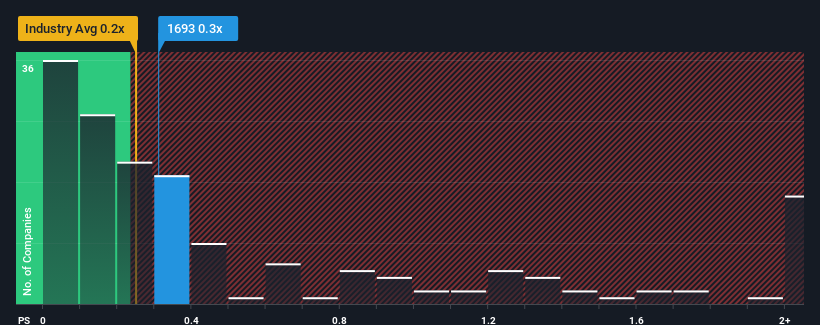
In spite of the heavy fall in price, there still wouldn't be many who think BGMC International's price-to-sales (or "P/S") ratio of 0.3x is worth a mention when the median P/S in Hong Kong's Construction industry is similar at about 0.2x. While this might not raise any eyebrows, if the P/S ratio is not justified investors could be missing out on a potential opportunity or ignoring looming disappointment.
See our latest analysis for BGMC International

How Has BGMC International Performed Recently?
Revenue has risen at a steady rate over the last year for BGMC International, which is generally not a bad outcome. It might be that many expect the respectable revenue performance to only match most other companies over the coming period, which has kept the P/S from rising. If not, then at least existing shareholders probably aren't too pessimistic about the future direction of the share price.
We don't have analyst forecasts, but you can see how recent trends are setting up the company for the future by checking out our free report on BGMC International's earnings, revenue and cash flow.Is There Some Revenue Growth Forecasted For BGMC International?
In order to justify its P/S ratio, BGMC International would need to produce growth that's similar to the industry.
If we review the last year of revenue growth, the company posted a worthy increase of 6.3%. However, this wasn't enough as the latest three year period has seen an unpleasant 63% overall drop in revenue. Accordingly, shareholders would have felt downbeat about the medium-term rates of revenue growth.
Weighing that medium-term revenue trajectory against the broader industry's one-year forecast for expansion of 10% shows it's an unpleasant look.
With this information, we find it concerning that BGMC International is trading at a fairly similar P/S compared to the industry. Apparently many investors in the company are way less bearish than recent times would indicate and aren't willing to let go of their stock right now. Only the boldest would assume these prices are sustainable as a continuation of recent revenue trends is likely to weigh on the share price eventually.
What We Can Learn From BGMC International's P/S?
With its share price dropping off a cliff, the P/S for BGMC International looks to be in line with the rest of the Construction industry. While the price-to-sales ratio shouldn't be the defining factor in whether you buy a stock or not, it's quite a capable barometer of revenue expectations.
We find it unexpected that BGMC International trades at a P/S ratio that is comparable to the rest of the industry, despite experiencing declining revenues during the medium-term, while the industry as a whole is expected to grow. Even though it matches the industry, we're uncomfortable with the current P/S ratio, as this dismal revenue performance is unlikely to support a more positive sentiment for long. Unless the the circumstances surrounding the recent medium-term improve, it wouldn't be wrong to expect a a difficult period ahead for the company's shareholders.
It's always necessary to consider the ever-present spectre of investment risk. We've identified 2 warning signs with BGMC International, and understanding these should be part of your investment process.
If these risks are making you reconsider your opinion on BGMC International, explore our interactive list of high quality stocks to get an idea of what else is out there.
If you're looking to trade BGMC International, open an account with the lowest-cost platform trusted by professionals, Interactive Brokers.
With clients in over 200 countries and territories, and access to 160 markets, IBKR lets you trade stocks, options, futures, forex, bonds and funds from a single integrated account.
Enjoy no hidden fees, no account minimums, and FX conversion rates as low as 0.03%, far better than what most brokers offer.
Sponsored ContentValuation is complex, but we're here to simplify it.
Discover if BGMC International might be undervalued or overvalued with our detailed analysis, featuring fair value estimates, potential risks, dividends, insider trades, and its financial condition.
Access Free AnalysisHave feedback on this article? Concerned about the content? Get in touch with us directly. Alternatively, email editorial-team (at) simplywallst.com.
This article by Simply Wall St is general in nature. We provide commentary based on historical data and analyst forecasts only using an unbiased methodology and our articles are not intended to be financial advice. It does not constitute a recommendation to buy or sell any stock, and does not take account of your objectives, or your financial situation. We aim to bring you long-term focused analysis driven by fundamental data. Note that our analysis may not factor in the latest price-sensitive company announcements or qualitative material. Simply Wall St has no position in any stocks mentioned.
About SEHK:1693
BGMC International
An investment holding company, provides construction services in Malaysia.
Slight and slightly overvalued.
Market Insights
Community Narratives


