
Advertisement
Investors Interested In Interlife General Insurance Company S.A.'s (ATH:INLIF) Revenues

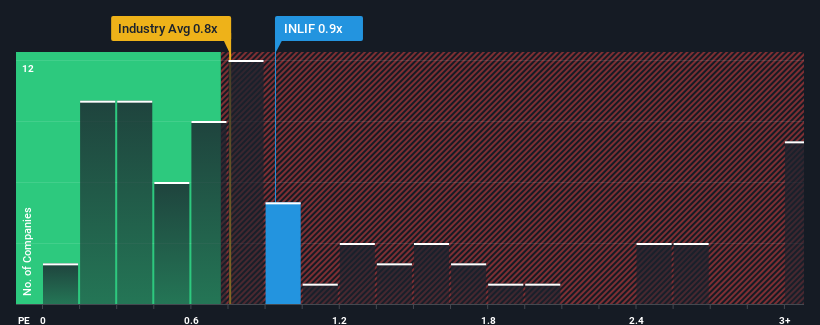
It's not a stretch to say that Interlife General Insurance Company S.A.'s (ATH:INLIF) price-to-sales (or "P/S") ratio of 0.9x right now seems quite "middle-of-the-road" for companies in the Insurance industry in Greece, where the median P/S ratio is around 0.8x. While this might not raise any eyebrows, if the P/S ratio is not justified investors could be missing out on a potential opportunity or ignoring looming disappointment.
See our latest analysis for Interlife General Insurance
What Does Interlife General Insurance's P/S Mean For Shareholders?
Recent times have been quite advantageous for Interlife General Insurance as its revenue has been rising very briskly. Perhaps the market is expecting future revenue performance to taper off, which has kept the P/S from rising. If that doesn't eventuate, then existing shareholders have reason to be feeling optimistic about the future direction of the share price.
Want the full picture on earnings, revenue and cash flow for the company? Then our free report on Interlife General Insurance will help you shine a light on its historical performance.Is There Some Revenue Growth Forecasted For Interlife General Insurance?
Interlife General Insurance's P/S ratio would be typical for a company that's only expected to deliver moderate growth, and importantly, perform in line with the industry.
If we review the last year of revenue growth, the company posted a terrific increase of 36%. The latest three year period has also seen an excellent 37% overall rise in revenue, aided by its short-term performance. So we can start by confirming that the company has done a great job of growing revenue over that time.
It's interesting to note that the rest of the industry is similarly expected to grow by 9.4% over the next year, which is fairly even with the company's recent medium-term annualised growth rates.
With this information, we can see why Interlife General Insurance is trading at a fairly similar P/S to the industry. It seems most investors are expecting to see average growth rates continue into the future and are only willing to pay a moderate amount for the stock.
What Does Interlife General Insurance's P/S Mean For Investors?
Using the price-to-sales ratio alone to determine if you should sell your stock isn't sensible, however it can be a practical guide to the company's future prospects.
As we've seen, Interlife General Insurance's three-year revenue trends seem to be contributing to its P/S, given they look similar to current industry expectations. Currently, with a past revenue trend that aligns closely wit the industry outlook, shareholders are confident the company's future revenue outlook won't contain any major surprises. Given the current circumstances, it seems improbable that the share price will experience any significant movement in either direction in the near future if recent medium-term revenue trends persist.
We don't want to rain on the parade too much, but we did also find 3 warning signs for Interlife General Insurance (1 can't be ignored!) that you need to be mindful of.
If these risks are making you reconsider your opinion on Interlife General Insurance, explore our interactive list of high quality stocks to get an idea of what else is out there.
New: AI Stock Screener & Alerts
Our new AI Stock Screener scans the market every day to uncover opportunities.
• Dividend Powerhouses (3%+ Yield)
• Undervalued Small Caps with Insider Buying
• High growth Tech and AI Companies
Or build your own from over 50 metrics.
Have feedback on this article? Concerned about the content? Get in touch with us directly. Alternatively, email editorial-team (at) simplywallst.com.
This article by Simply Wall St is general in nature. We provide commentary based on historical data and analyst forecasts only using an unbiased methodology and our articles are not intended to be financial advice. It does not constitute a recommendation to buy or sell any stock, and does not take account of your objectives, or your financial situation. We aim to bring you long-term focused analysis driven by fundamental data. Note that our analysis may not factor in the latest price-sensitive company announcements or qualitative material. Simply Wall St has no position in any stocks mentioned.
About ATSE:INLIF
Interlife General Insurance
Operates as a general insurance company for individual and business in Greece.
Flawless balance sheet second-rate dividend payer.
Market Insights

Advertisement
Community Narratives
Scaling up in building materials with smart M&A and growing profitability
Fair Value US$2.77|31.0% undervalued
CM
Community Contributor
Hims: The Platform Powering Personalised Healthcare
Fair Value US$114.01|53.1% undervalued
BL
Community Contributor
Undervalued lottery company with strong fundamentals
Fair Value AU$15.00|35.4% undervalued
RO
Community Contributor
Proximus, transferring money from the impatient to the patient investor
Fair Value €16.62|54.5% undervalued
AX
Community Contributor