Advertisement
- United Kingdom
- /
- Software
- /
- LSE:BYIT
Calculating The Fair Value Of Bytes Technology Group plc (LON:BYIT)
Key Insights
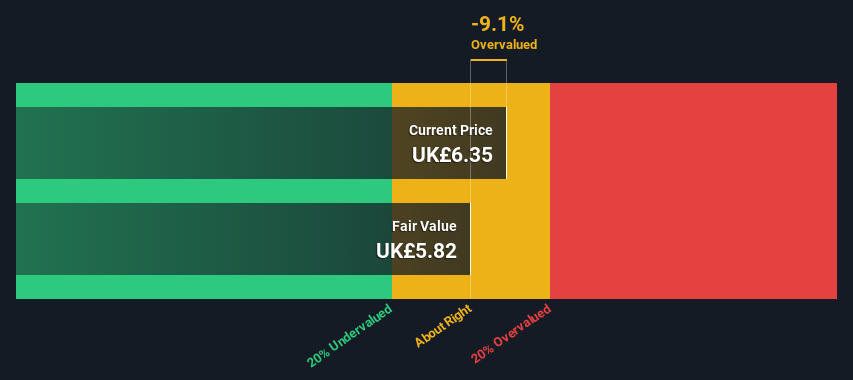
- Using the 2 Stage Free Cash Flow to Equity, Bytes Technology Group fair value estimate is UK£5.82
- With UK£6.35 share price, Bytes Technology Group appears to be trading close to its estimated fair value
- Analyst price target for BYIT is UK£6.31, which is 8.4% above our fair value estimate
Today we will run through one way of estimating the intrinsic value of Bytes Technology Group plc (LON:BYIT) by taking the expected future cash flows and discounting them to their present value. One way to achieve this is by employing the Discounted Cash Flow (DCF) model. Before you think you won't be able to understand it, just read on! It's actually much less complex than you'd imagine.
Companies can be valued in a lot of ways, so we would point out that a DCF is not perfect for every situation. Anyone interested in learning a bit more about intrinsic value should have a read of the Simply Wall St analysis model.
See our latest analysis for Bytes Technology Group
Crunching The Numbers
We're using the 2-stage growth model, which simply means we take in account two stages of company's growth. In the initial period the company may have a higher growth rate and the second stage is usually assumed to have a stable growth rate. To begin with, we have to get estimates of the next ten years of cash flows. Where possible we use analyst estimates, but when these aren't available we extrapolate the previous free cash flow (FCF) from the last estimate or reported value. We assume companies with shrinking free cash flow will slow their rate of shrinkage, and that companies with growing free cash flow will see their growth rate slow, over this period. We do this to reflect that growth tends to slow more in the early years than it does in later years.
Generally we assume that a dollar today is more valuable than a dollar in the future, so we need to discount the sum of these future cash flows to arrive at a present value estimate:
10-year free cash flow (FCF) forecast
| 2024 | 2025 | 2026 | 2027 | 2028 | 2029 | 2030 | 2031 | 2032 | 2033 | |
| Levered FCF (£, Millions) | UK£56.4m | UK£63.5m | UK£70.2m | UK£75.1m | UK£82.0m | UK£87.0m | UK£91.1m | UK£94.5m | UK£97.5m | UK£100.0m |
| Growth Rate Estimate Source | Analyst x4 | Analyst x4 | Analyst x4 | Analyst x2 | Analyst x1 | Est @ 6.10% | Est @ 4.73% | Est @ 3.76% | Est @ 3.09% | Est @ 2.62% |
| Present Value (£, Millions) Discounted @ 7.4% | UK£52.5 | UK£55.0 | UK£56.7 | UK£56.5 | UK£57.5 | UK£56.8 | UK£55.4 | UK£53.6 | UK£51.4 | UK£49.2 |
("Est" = FCF growth rate estimated by Simply Wall St)
Present Value of 10-year Cash Flow (PVCF) = UK£545m
The second stage is also known as Terminal Value, this is the business's cash flow after the first stage. For a number of reasons a very conservative growth rate is used that cannot exceed that of a country's GDP growth. In this case we have used the 5-year average of the 10-year government bond yield (1.5%) to estimate future growth. In the same way as with the 10-year 'growth' period, we discount future cash flows to today's value, using a cost of equity of 7.4%.
Terminal Value (TV)= FCF2033 × (1 + g) ÷ (r – g) = UK£100m× (1 + 1.5%) ÷ (7.4%– 1.5%) = UK£1.7b
Present Value of Terminal Value (PVTV)= TV / (1 + r)10= UK£1.7b÷ ( 1 + 7.4%)10= UK£854m
The total value, or equity value, is then the sum of the present value of the future cash flows, which in this case is UK£1.4b. To get the intrinsic value per share, we divide this by the total number of shares outstanding. Compared to the current share price of UK£6.4, the company appears around fair value at the time of writing. Valuations are imprecise instruments though, rather like a telescope - move a few degrees and end up in a different galaxy. Do keep this in mind.
Important Assumptions
The calculation above is very dependent on two assumptions. The first is the discount rate and the other is the cash flows. Part of investing is coming up with your own evaluation of a company's future performance, so try the calculation yourself and check your own assumptions. The DCF also does not consider the possible cyclicality of an industry, or a company's future capital requirements, so it does not give a full picture of a company's potential performance. Given that we are looking at Bytes Technology Group as potential shareholders, the cost of equity is used as the discount rate, rather than the cost of capital (or weighted average cost of capital, WACC) which accounts for debt. In this calculation we've used 7.4%, which is based on a levered beta of 0.989. Beta is a measure of a stock's volatility, compared to the market as a whole. We get our beta from the industry average beta of globally comparable companies, with an imposed limit between 0.8 and 2.0, which is a reasonable range for a stable business.
SWOT Analysis for Bytes Technology Group
Strength
- Earnings growth over the past year exceeded its 5-year average.
- Currently debt free.
- Dividends are covered by earnings and cash flows.
Weakness
- Earnings growth over the past year underperformed the Software industry.
- Dividend is low compared to the top 25% of dividend payers in the Software market.
- Expensive based on P/E ratio and estimated fair value.
Opportunity
- Annual earnings are forecast to grow faster than the British market.
Threat
- Revenue is forecast to grow slower than 20% per year.
Moving On:
Valuation is only one side of the coin in terms of building your investment thesis, and it ideally won't be the sole piece of analysis you scrutinize for a company. The DCF model is not a perfect stock valuation tool. Preferably you'd apply different cases and assumptions and see how they would impact the company's valuation. For example, changes in the company's cost of equity or the risk free rate can significantly impact the valuation. For Bytes Technology Group, we've compiled three further items you should further research:
- Risks: For instance, we've identified 2 warning signs for Bytes Technology Group that you should be aware of.
- Future Earnings: How does BYIT's growth rate compare to its peers and the wider market? Dig deeper into the analyst consensus number for the upcoming years by interacting with our free analyst growth expectation chart.
- Other High Quality Alternatives: Do you like a good all-rounder? Explore our interactive list of high quality stocks to get an idea of what else is out there you may be missing!
PS. Simply Wall St updates its DCF calculation for every British stock every day, so if you want to find the intrinsic value of any other stock just search here.
Valuation is complex, but we're here to simplify it.
Discover if Bytes Technology Group might be undervalued or overvalued with our detailed analysis, featuring fair value estimates, potential risks, dividends, insider trades, and its financial condition.
Access Free AnalysisHave feedback on this article? Concerned about the content? Get in touch with us directly. Alternatively, email editorial-team (at) simplywallst.com.
This article by Simply Wall St is general in nature. We provide commentary based on historical data and analyst forecasts only using an unbiased methodology and our articles are not intended to be financial advice. It does not constitute a recommendation to buy or sell any stock, and does not take account of your objectives, or your financial situation. We aim to bring you long-term focused analysis driven by fundamental data. Note that our analysis may not factor in the latest price-sensitive company announcements or qualitative material. Simply Wall St has no position in any stocks mentioned.
About LSE:BYIT
Bytes Technology Group
Offers software, security, AI, and cloud services in the United Kingdom, Europe, and internationally.
Flawless balance sheet and good value.
Similar Companies
Market Insights


Advertisement
Weekly Picks
LO


Lou_Basenese on Optimi Health ·
The Only Psychedelic Company Already Selling MDMA and Psilocybin to Real Patients, Yet Priced Like It Doesn’t Exist
Fair Value:US$1155.3% undervalued
49 followersusers have followed this narrative
2 commentsusers have commented on this narrative
9 likesusers have liked this narrative
WE


WealthAP on Novo Nordisk ·
Novo Nordisk (NVO): Is the "Easy Growth" Story Over?
Fair Value:DKK 407.7720.1% undervalued
69 followersusers have followed this narrative
0 commentsusers have commented on this narrative
8 likesusers have liked this narrative
VA


ValueInvestingSubstack on Zoetis ·
Zoetis down -50% over the past year
Fair Value:US$92.9217.2% undervalued
23 followersusers have followed this narrative
0 commentsusers have commented on this narrative
9 likesusers have liked this narrative
CE


CentryResearch on Centrus Energy ·
Centrus Energy: The Next Nuclear Bottleneck Isn't Reactors. It's Fuel.
Fair Value:US$1907.4% undervalued
24 followersusers have followed this narrative
0 commentsusers have commented on this narrative
10 likesusers have liked this narrative
Recently Updated Narratives
FE

FernandoLeal on Compass Gas e Energia ·
Compass Gas e Energia has a reliable dividend, with a consistent moat, high free cash flow margins and will expand to two digits net margin.
Fair Value:R$40.9438.2% undervalued
2 followersusers have followed this narrative
0 commentsusers have commented on this narrative
0 likesusers have liked this narrative
BR


Brunhilde_Wagner on Copart ·
Compounder to Cash Generator in Real Time
Fair Value:US$2710.3% overvalued
1 followerusers have followed this narrative
0 commentsusers have commented on this narrative
0 likesusers have liked this narrative
WI

WisetoWealth on PayPal Holdings ·
The Underrated Transformation of a Digital Payments Giant
Fair Value:US$90.3137.9% undervalued
5 followersusers have followed this narrative
0 commentsusers have commented on this narrative
0 likesusers have liked this narrative
Popular Narratives
CU

CubanEros on Microsoft ·
A wonderful business at reasonable price.
Fair Value:US$419.917.3% undervalued
84 followersusers have followed this narrative
0 commentsusers have commented on this narrative
6 likesusers have liked this narrative
OS


oscargarcia on NVIDIA ·
The company that went from selling GPUs to gamers to becoming the AI arms dealer of the 21st century.
Fair Value:US$28029.8% undervalued
192 followersusers have followed this narrative
9 commentsusers have commented on this narrative
15 likesusers have liked this narrative
BE
benjamin_lvieq on PayPal Holdings ·
PayPal: PayPal Doesn't Need to Grow – It Needs to Stop Falling – A Mispriced Cash Machine With a Cannibal Buyback
Fair Value:US$6513.7% undervalued
72 followersusers have followed this narrative
2 commentsusers have commented on this narrative
11 likesusers have liked this narrative
Trending Discussion
DE

derek_3wsdg on Teladoc Health ·
You’ve overlooked the activist investor factor. Travis Cocke’s Voss has announced 5% ownership through a 13G filing. They’ve added to that 5% since, and in doing so, have created a structural trap door for 27.42 Million Shares actively sold short. Chuck will announce lots of positives on July 29 but it’s what Voss announces shortly after that will rock the overextended Teledoc shorts. The Walmart partnership is the tip of the iceberg. The market is missing the sheer regulatory and enterprise friction of modern corporate healthcare. Teladoc isn't a "consumer app"; it is the primary digital infrastructure integrated directly into the legacy backends of Tier-1 insurance companies and fortune 500 employers, covering 105 million+ lives. Teladoc is acting as the digital top-of-funnel engine for the world's largest retailer. If Voss pushes the narrative that Teladoc is effectively the outsourced digital brain of Walmart's entire healthcare footprint, the fair value shifts from a basic health multiple to an enterprise distribution premium. Additionally , we are in a structural gold rush for high-quality, legally compliant, longitudinal medical data to train vertical healthcare AI models. Large technology hyperscalers and pharmaceutical giants cannot simply scrape the internet for this; they need structured clinical inputs. Teladoc sits on one of the largest de-identified virtual medical datasets on earth. From the activist playbook , we’ll see Voss demand the immediate creation of a Data & Diagnostics Licensing Division, transforming a legacy liability into an incredibly high-margin, pure-software data asset that requires zero human clinician hours to scale. Chuck is doing great work and deserves credi5 for the Teledoc turnaround but it will be Travis Cocke who will be responsible for a share price way beyond your $15 valuation.
1
|0

