- United Kingdom
- /
- Real Estate
- /
- AIM:WJG
Investors three-year losses continue as Watkin Jones (LON:WJG) dips a further 11% this week, earnings continue to decline
It is a pleasure to report that the Watkin Jones Plc (LON:WJG) is up 33% in the last quarter. But only the myopic could ignore the astounding decline over three years. The share price has sunk like a leaky ship, down 89% in that time. So it's about time shareholders saw some gains. But the more important question is whether the underlying business can justify a higher price still. We really hope anyone holding through that price crash has a diversified portfolio. Even when you lose money, you don't have to lose the lesson.
With the stock having lost 11% in the past week, it's worth taking a look at business performance and seeing if there's any red flags.
While markets are a powerful pricing mechanism, share prices reflect investor sentiment, not just underlying business performance. By comparing earnings per share (EPS) and share price changes over time, we can get a feel for how investor attitudes to a company have morphed over time.
During five years of share price growth, Watkin Jones moved from a loss to profitability. We would usually expect to see the share price rise as a result. So it's worth looking at other metrics to try to understand the share price move.
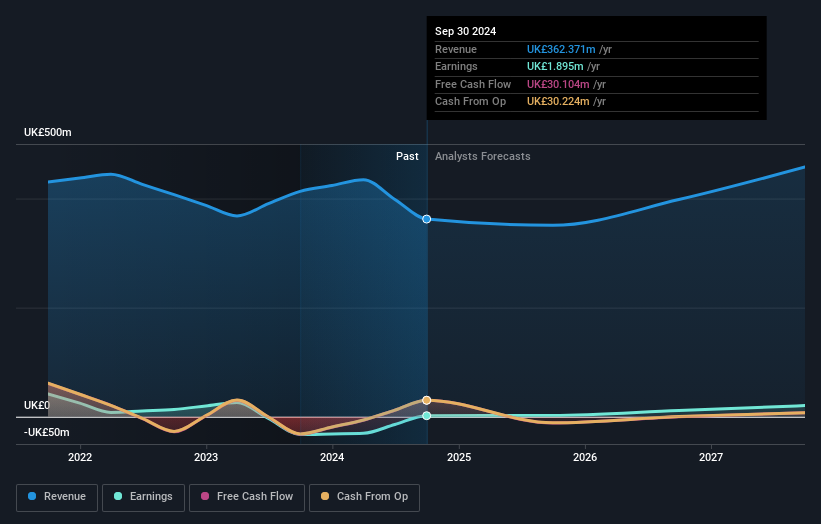
Arguably the revenue decline of 3.4% per year has people thinking Watkin Jones is shrinking. After all, if revenue keeps shrinking, it may be difficult to find earnings growth in the future.
The company's revenue and earnings (over time) are depicted in the image below (click to see the exact numbers).

It's probably worth noting we've seen significant insider buying in the last quarter, which we consider a positive. That said, we think earnings and revenue growth trends are even more important factors to consider. This free report showing analyst forecasts should help you form a view on Watkin Jones
A Different Perspective
While the broader market gained around 9.9% in the last year, Watkin Jones shareholders lost 33%. However, keep in mind that even the best stocks will sometimes underperform the market over a twelve month period. Unfortunately, last year's performance may indicate unresolved challenges, given that it was worse than the annualised loss of 12% over the last half decade. Generally speaking long term share price weakness can be a bad sign, though contrarian investors might want to research the stock in hope of a turnaround. It's always interesting to track share price performance over the longer term. But to understand Watkin Jones better, we need to consider many other factors. Case in point: We've spotted 3 warning signs for Watkin Jones you should be aware of, and 1 of them is concerning.
Watkin Jones is not the only stock that insiders are buying. For those who like to find lesser know companies this free list of growing companies with recent insider purchasing, could be just the ticket.
Please note, the market returns quoted in this article reflect the market weighted average returns of stocks that currently trade on British exchanges.
Valuation is complex, but we're here to simplify it.
Discover if Watkin Jones might be undervalued or overvalued with our detailed analysis, featuring fair value estimates, potential risks, dividends, insider trades, and its financial condition.
Access Free AnalysisHave feedback on this article? Concerned about the content? Get in touch with us directly. Alternatively, email editorial-team (at) simplywallst.com.
This article by Simply Wall St is general in nature. We provide commentary based on historical data and analyst forecasts only using an unbiased methodology and our articles are not intended to be financial advice. It does not constitute a recommendation to buy or sell any stock, and does not take account of your objectives, or your financial situation. We aim to bring you long-term focused analysis driven by fundamental data. Note that our analysis may not factor in the latest price-sensitive company announcements or qualitative material. Simply Wall St has no position in any stocks mentioned.
About AIM:WJG
Watkin Jones
Engages in the development and the management of properties for residential occupation in the United Kingdom.
Excellent balance sheet with reasonable growth potential.
Market Insights
Community Narratives


