- United Kingdom
- /
- Media
- /
- LSE:ITV
0.2% earnings growth over 5 years has not materialized into gains for ITV (LON:ITV) shareholders over that period


Ideally, your overall portfolio should beat the market average. But the main game is to find enough winners to more than offset the losers So we wouldn't blame long term ITV plc (LON:ITV) shareholders for doubting their decision to hold, with the stock down 30% over a half decade. On top of that, the share price is down 5.4% in the last week.
Given the past week has been tough on shareholders, let's investigate the fundamentals and see what we can learn.
Check out our latest analysis for ITV
There is no denying that markets are sometimes efficient, but prices do not always reflect underlying business performance. One way to examine how market sentiment has changed over time is to look at the interaction between a company's share price and its earnings per share (EPS).
While the share price declined over five years, ITV actually managed to increase EPS by an average of 0.9% per year. So it doesn't seem like EPS is a great guide to understanding how the market is valuing the stock. Or possibly, the market was previously very optimistic, so the stock has disappointed, despite improving EPS.
Based on these numbers, we'd venture that the market may have been over-optimistic about forecast growth, half a decade ago. Having said that, we might get a better idea of what's going on with the stock by looking at other metrics.
The most recent dividend was actually lower than it was in the past, so that may have sent the share price lower.
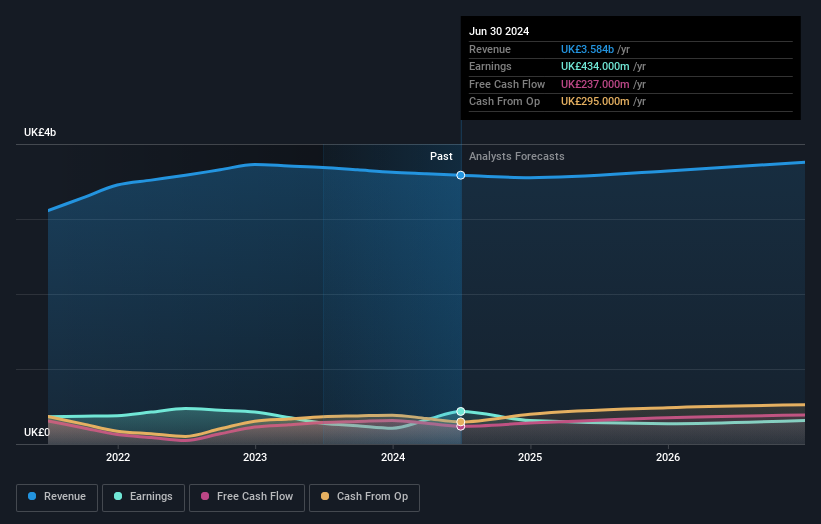
You can see below how earnings and revenue have changed over time (discover the exact values by clicking on the image).
We know that ITV has improved its bottom line lately, but what does the future have in store? This free report showing analyst forecasts should help you form a view on ITV
What About Dividends?
It is important to consider the total shareholder return, as well as the share price return, for any given stock. The TSR is a return calculation that accounts for the value of cash dividends (assuming that any dividend received was reinvested) and the calculated value of any discounted capital raisings and spin-offs. It's fair to say that the TSR gives a more complete picture for stocks that pay a dividend. As it happens, ITV's TSR for the last 5 years was -15%, which exceeds the share price return mentioned earlier. This is largely a result of its dividend payments!
A Different Perspective
It's nice to see that ITV shareholders have received a total shareholder return of 19% over the last year. And that does include the dividend. That certainly beats the loss of about 3% per year over the last half decade. The long term loss makes us cautious, but the short term TSR gain certainly hints at a brighter future. I find it very interesting to look at share price over the long term as a proxy for business performance. But to truly gain insight, we need to consider other information, too. To that end, you should learn about the 3 warning signs we've spotted with ITV (including 1 which can't be ignored) .
If you like to buy stocks alongside management, then you might just love this free list of companies. (Hint: many of them are unnoticed AND have attractive valuation).
Please note, the market returns quoted in this article reflect the market weighted average returns of stocks that currently trade on British exchanges.
New: AI Stock Screener & Alerts
Our new AI Stock Screener scans the market every day to uncover opportunities.
• Dividend Powerhouses (3%+ Yield)
• Undervalued Small Caps with Insider Buying
• High growth Tech and AI Companies
Or build your own from over 50 metrics.
Have feedback on this article? Concerned about the content? Get in touch with us directly. Alternatively, email editorial-team (at) simplywallst.com.
This article by Simply Wall St is general in nature. We provide commentary based on historical data and analyst forecasts only using an unbiased methodology and our articles are not intended to be financial advice. It does not constitute a recommendation to buy or sell any stock, and does not take account of your objectives, or your financial situation. We aim to bring you long-term focused analysis driven by fundamental data. Note that our analysis may not factor in the latest price-sensitive company announcements or qualitative material. Simply Wall St has no position in any stocks mentioned.
About LSE:ITV
ITV
An integrated production, broadcasting, and streaming company, which creates, owns, and distributes content on various platforms worldwide.
Flawless balance sheet, undervalued and pays a dividend.
Similar Companies
Market Insights

Community Narratives
