- United Kingdom
- /
- Luxury
- /
- LSE:COA
UK Stocks Estimated To Be Trading Below Intrinsic Value In February 2025

Reviewed by Simply Wall St

As the FTSE 100 and FTSE 250 indices experience downward pressure due to weak trade data from China, concerns about global economic recovery continue to weigh on investor sentiment in the United Kingdom. In such a challenging market environment, identifying stocks that are trading below their intrinsic value can present opportunities for investors looking to capitalize on potential long-term growth.
Top 10 Undervalued Stocks Based On Cash Flows In The United Kingdom
| Name | Current Price | Fair Value (Est) | Discount (Est) |
| On the Beach Group (LSE:OTB) | £2.25 | £4.48 | 49.7% |
| Gaming Realms (AIM:GMR) | £0.372 | £0.67 | 44.7% |
| Legal & General Group (LSE:LGEN) | £2.437 | £4.86 | 49.8% |
| Victrex (LSE:VCT) | £9.13 | £18.15 | 49.7% |
| Gateley (Holdings) (AIM:GTLY) | £1.37 | £2.65 | 48.4% |
| AstraZeneca (LSE:AZN) | £120.18 | £220.00 | 45.4% |
| Likewise Group (AIM:LIKE) | £0.195 | £0.37 | 47.7% |
| Calnex Solutions (AIM:CLX) | £0.555 | £1.01 | 45% |
| Optima Health (AIM:OPT) | £1.83 | £3.33 | 45% |
| Melrose Industries (LSE:MRO) | £6.222 | £12.19 | 49% |
Below we spotlight a couple of our favorites from our exclusive screener.
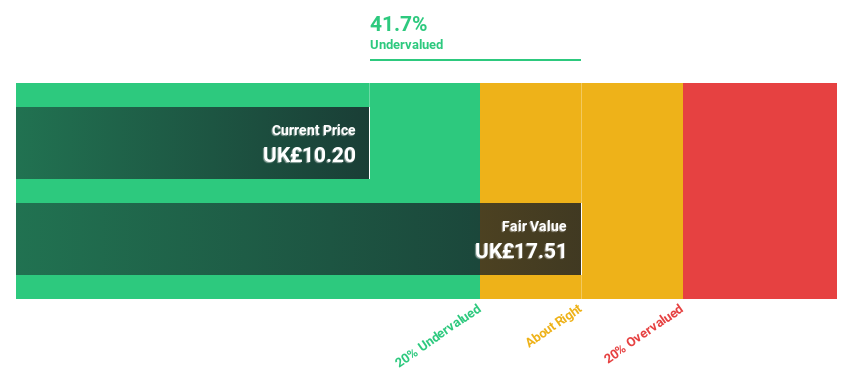
CVS Group (AIM:CVSG)
Overview: CVS Group plc operates in the veterinary, pet crematoria, online pharmacy, and retail sectors with a market cap of £744.66 million.
Operations: The company generates revenue through its operations in veterinary services, pet crematoria, online pharmacy, and retail businesses.
Estimated Discount To Fair Value: 38.6%
CVS Group is trading at £10.38, significantly below its estimated fair value of £16.92, indicating it may be undervalued based on cash flows. Despite a decline in net income to £11.2 million from £14.6 million year-over-year, earnings are forecast to grow significantly at 22.8% annually over the next three years, outpacing the UK market's growth rate of 14.5%. However, profit margins have decreased and interest payments are not well covered by earnings.
- Upon reviewing our latest growth report, CVS Group's projected financial performance appears quite optimistic.
- Click to explore a detailed breakdown of our findings in CVS Group's balance sheet health report.
Coats Group (LSE:COA)
Overview: Coats Group plc, along with its subsidiaries, manufactures and supplies industrial sewing threads globally and has a market cap of £1.41 billion.
Operations: The company's revenue segments consist of Apparel at $731 million, Footwear at $381.90 million, and Performance Materials at $327 million.
Estimated Discount To Fair Value: 40.6%
Coats Group is trading at £0.88, significantly below its estimated fair value of £1.49, suggesting it is undervalued based on cash flows. Revenue growth is projected to outpace the UK market at 5.9% annually, while earnings are expected to rise by 17.3% per year, surpassing the market's rate of 14.5%. Despite a high debt level and an unstable dividend history, analysts anticipate a price increase of 38.7%.
- The analysis detailed in our Coats Group growth report hints at robust future financial performance.
- Dive into the specifics of Coats Group here with our thorough financial health report.

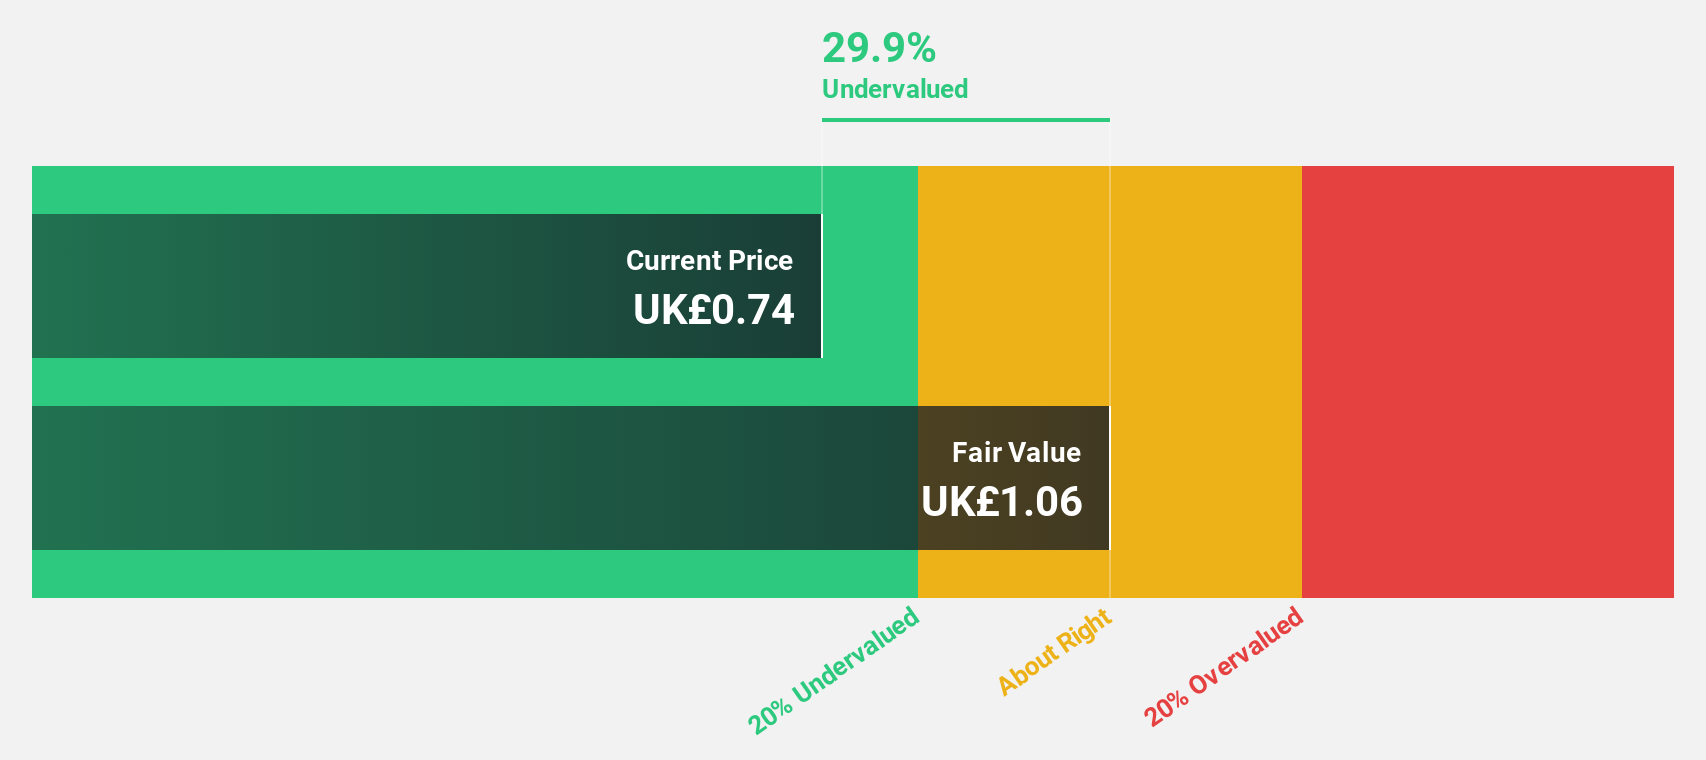
Dr. Martens (LSE:DOCS)
Overview: Dr. Martens plc designs, develops, procures, markets, sells, and distributes footwear under the Dr. Martens brand and has a market cap of approximately £660.59 million.
Operations: Dr. Martens generates revenue primarily from its footwear segment, which amounts to £805.90 million.
Estimated Discount To Fair Value: 44.1%
Dr. Martens is trading at £0.69, considerably below its estimated fair value of £1.23, highlighting its undervaluation based on cash flows. The company forecasts a robust annual earnings growth of 40.6%, significantly exceeding the UK market's average growth rate of 14.5%. However, recent financials show a decline in profit margins from 10.6% to 3.6% and an unstable dividend history, which may temper investor enthusiasm despite expected revenue growth surpassing the market average at 4.7%.
- Our growth report here indicates Dr. Martens may be poised for an improving outlook.
- Click here to discover the nuances of Dr. Martens with our detailed financial health report.
Where To Now?
- Discover the full array of 56 Undervalued UK Stocks Based On Cash Flows right here.
- Have a stake in these businesses? Integrate your holdings into Simply Wall St's portfolio for notifications and detailed stock reports.
- Elevate your portfolio with Simply Wall St, the ultimate app for investors seeking global market coverage.
Ready To Venture Into Other Investment Styles?
- Explore high-performing small cap companies that haven't yet garnered significant analyst attention.
- Diversify your portfolio with solid dividend payers offering reliable income streams to weather potential market turbulence.
- Fuel your portfolio with companies showing strong growth potential, backed by optimistic outlooks both from analysts and management.
This article by Simply Wall St is general in nature. We provide commentary based on historical data and analyst forecasts only using an unbiased methodology and our articles are not intended to be financial advice. It does not constitute a recommendation to buy or sell any stock, and does not take account of your objectives, or your financial situation. We aim to bring you long-term focused analysis driven by fundamental data. Note that our analysis may not factor in the latest price-sensitive company announcements or qualitative material. Simply Wall St has no position in any stocks mentioned.
New: AI Stock Screener & Alerts
Our new AI Stock Screener scans the market every day to uncover opportunities.
• Dividend Powerhouses (3%+ Yield)
• Undervalued Small Caps with Insider Buying
• High growth Tech and AI Companies
Or build your own from over 50 metrics.
Have feedback on this article? Concerned about the content? Get in touch with us directly. Alternatively, email editorial-team@simplywallst.com
About LSE:COA
Coats Group
Manufactures and supplies industrial sewing threads worldwide.
Very undervalued with solid track record.
Market Insights

Community Narratives
