The harsh reality for SIG plc (LON:SHI) shareholders is that its auditors, Ernst & Young LLP, expressed doubts about its ability to continue as a going concern, in its reported results to December 2020. This means that, based on the financial results to that date, the company arguably should raise capital, or otherwise strengthen the balance sheet, as soon as possible.
Given its situation, it may not be in a good position to raise capital on favorable terms. So it is suddenly extremely important to consider whether the company is taking too much risk on its balance sheet. Debt is always a risk factor in these cases, as creditors could be in a position to wind up the company, in the worst case scenario.
See our latest analysis for SIG
What Is SIG's Net Debt?
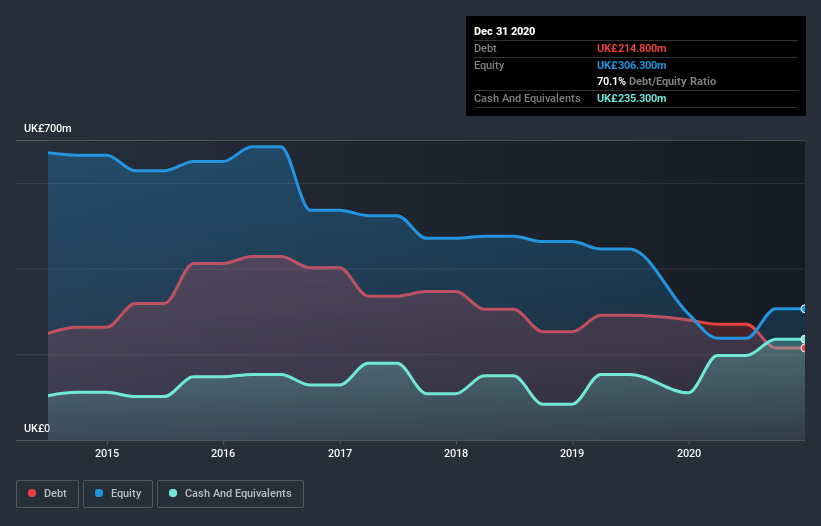
The image below, which you can click on for greater detail, shows that SIG had debt of UK£214.8m at the end of December 2020, a reduction from UK£280.1m over a year. However, its balance sheet shows it holds UK£235.3m in cash, so it actually has UK£20.5m net cash.

A Look At SIG's Liabilities
The latest balance sheet data shows that SIG had liabilities of UK£368.2m due within a year, and liabilities of UK£480.1m falling due after that. Offsetting this, it had UK£235.3m in cash and UK£244.7m in receivables that were due within 12 months. So its liabilities outweigh the sum of its cash and (near-term) receivables by UK£368.3m.
This deficit is considerable relative to its market capitalization of UK£454.3m, so it does suggest shareholders should keep an eye on SIG's use of debt. Should its lenders demand that it shore up the balance sheet, shareholders would likely face severe dilution. Despite its noteworthy liabilities, SIG boasts net cash, so it's fair to say it does not have a heavy debt load! When analysing debt levels, the balance sheet is the obvious place to start. But it is future earnings, more than anything, that will determine SIG's ability to maintain a healthy balance sheet going forward. So if you're focused on the future you can check out this free report showing analyst profit forecasts.
In the last year SIG had a loss before interest and tax, and actually shrunk its revenue by 13%, to UK£1.9b. That's not what we would hope to see.
So How Risky Is SIG?
We have no doubt that loss making companies are, in general, riskier than profitable ones. And in the last year SIG had an earnings before interest and tax (EBIT) loss, truth be told. Indeed, in that time it burnt through UK£74m of cash and made a loss of UK£209m. Given it only has net cash of UK£20.5m, the company may need to raise more capital if it doesn't reach break-even soon. Overall, we'd say the stock is a bit risky, and we're usually very cautious until we see positive free cash flow. We're too cautious to want to invest in a company after an auditor has expressed doubts about its ability to continue as a going concern. That's because we find it more comfortable to invest in companies that always keep the balance sheet reasonably strong. When analysing debt levels, the balance sheet is the obvious place to start. However, not all investment risk resides within the balance sheet - far from it. Case in point: We've spotted 2 warning signs for SIG you should be aware of, and 1 of them doesn't sit too well with us.
At the end of the day, it's often better to focus on companies that are free from net debt. You can access our special list of such companies (all with a track record of profit growth). It's free.
If you’re looking to trade SIG, open an account with the lowest-cost* platform trusted by professionals, Interactive Brokers. Their clients from over 200 countries and territories trade stocks, options, futures, forex, bonds and funds worldwide from a single integrated account. Promoted
New: Manage All Your Stock Portfolios in One Place
We've created the ultimate portfolio companion for stock investors, and it's free.
• Connect an unlimited number of Portfolios and see your total in one currency
• Be alerted to new Warning Signs or Risks via email or mobile
• Track the Fair Value of your stocks
This article by Simply Wall St is general in nature. It does not constitute a recommendation to buy or sell any stock, and does not take account of your objectives, or your financial situation. We aim to bring you long-term focused analysis driven by fundamental data. Note that our analysis may not factor in the latest price-sensitive company announcements or qualitative material. Simply Wall St has no position in any stocks mentioned.
*Interactive Brokers Rated Lowest Cost Broker by StockBrokers.com Annual Online Review 2020
Have feedback on this article? Concerned about the content? Get in touch with us directly. Alternatively, email editorial-team (at) simplywallst.com.
About LSE:SHI
SIG
Supplies specialist insulation and sustainable building products and solutions in the United Kingdom, Germany, France, Benelux, Poland, and Ireland.
Adequate balance sheet and fair value.
Similar Companies
Market Insights
Community Narratives


