Advertisement
- United Kingdom
- /
- Renewable Energy
- /
- LSE:DRX
UK Dividend Stocks To Consider In September 2025

Simply Wall St
Reviewed by Simply Wall St
As the FTSE 100 and FTSE 250 indices have recently experienced declines, largely influenced by weak trade data from China and falling commodity prices, investors in the UK are navigating a challenging market environment. In such conditions, dividend stocks can offer a measure of stability and income potential, as they often represent companies with robust cash flows and resilient business models.
Top 10 Dividend Stocks In The United Kingdom
| Name | Dividend Yield | Dividend Rating |
| Treatt (LSE:TET) | 3.75% | ★★★★★☆ |
| Seplat Energy (LSE:SEPL) | 6.36% | ★★★★★☆ |
| RS Group (LSE:RS1) | 3.92% | ★★★★★☆ |
| Pets at Home Group (LSE:PETS) | 5.67% | ★★★★★★ |
| OSB Group (LSE:OSB) | 6.27% | ★★★★★☆ |
| NWF Group (AIM:NWF) | 4.90% | ★★★★★☆ |
| MONY Group (LSE:MONY) | 6.15% | ★★★★★★ |
| Keller Group (LSE:KLR) | 3.94% | ★★★★★☆ |
| Dunelm Group (LSE:DNLM) | 6.45% | ★★★★★☆ |
| 4imprint Group (LSE:FOUR) | 5.16% | ★★★★★☆ |
Click here to see the full list of 53 stocks from our Top UK Dividend Stocks screener.
We'll examine a selection from our screener results.
NWF Group (AIM:NWF)
Simply Wall St Dividend Rating: ★★★★★☆
Overview: NWF Group plc, with a market cap of £85.04 million, is involved in the sale and distribution of fuel oils across the United Kingdom through its subsidiaries.
Operations: NWF Group plc generates revenue through its three main segments: Food (£86.30 million), Feeds (£204.60 million), and Fuels (£620.40 million).
Dividend Yield: 4.9%
NWF Group's dividend payments have been stable and reliable over the past decade, supported by a low cash payout ratio of 20.9% and a reasonable earnings payout ratio of 67%. While its dividend yield of 4.9% is below the top UK payers, NWF has consistently increased dividends, with the latest rise to 8.4 pence per share for fiscal year ending May 2025. The company is actively pursuing acquisitions to bolster growth despite recent declines in sales and net income.
- Navigate through the intricacies of NWF Group with our comprehensive dividend report here.
- Our expertly prepared valuation report NWF Group implies its share price may be too high.
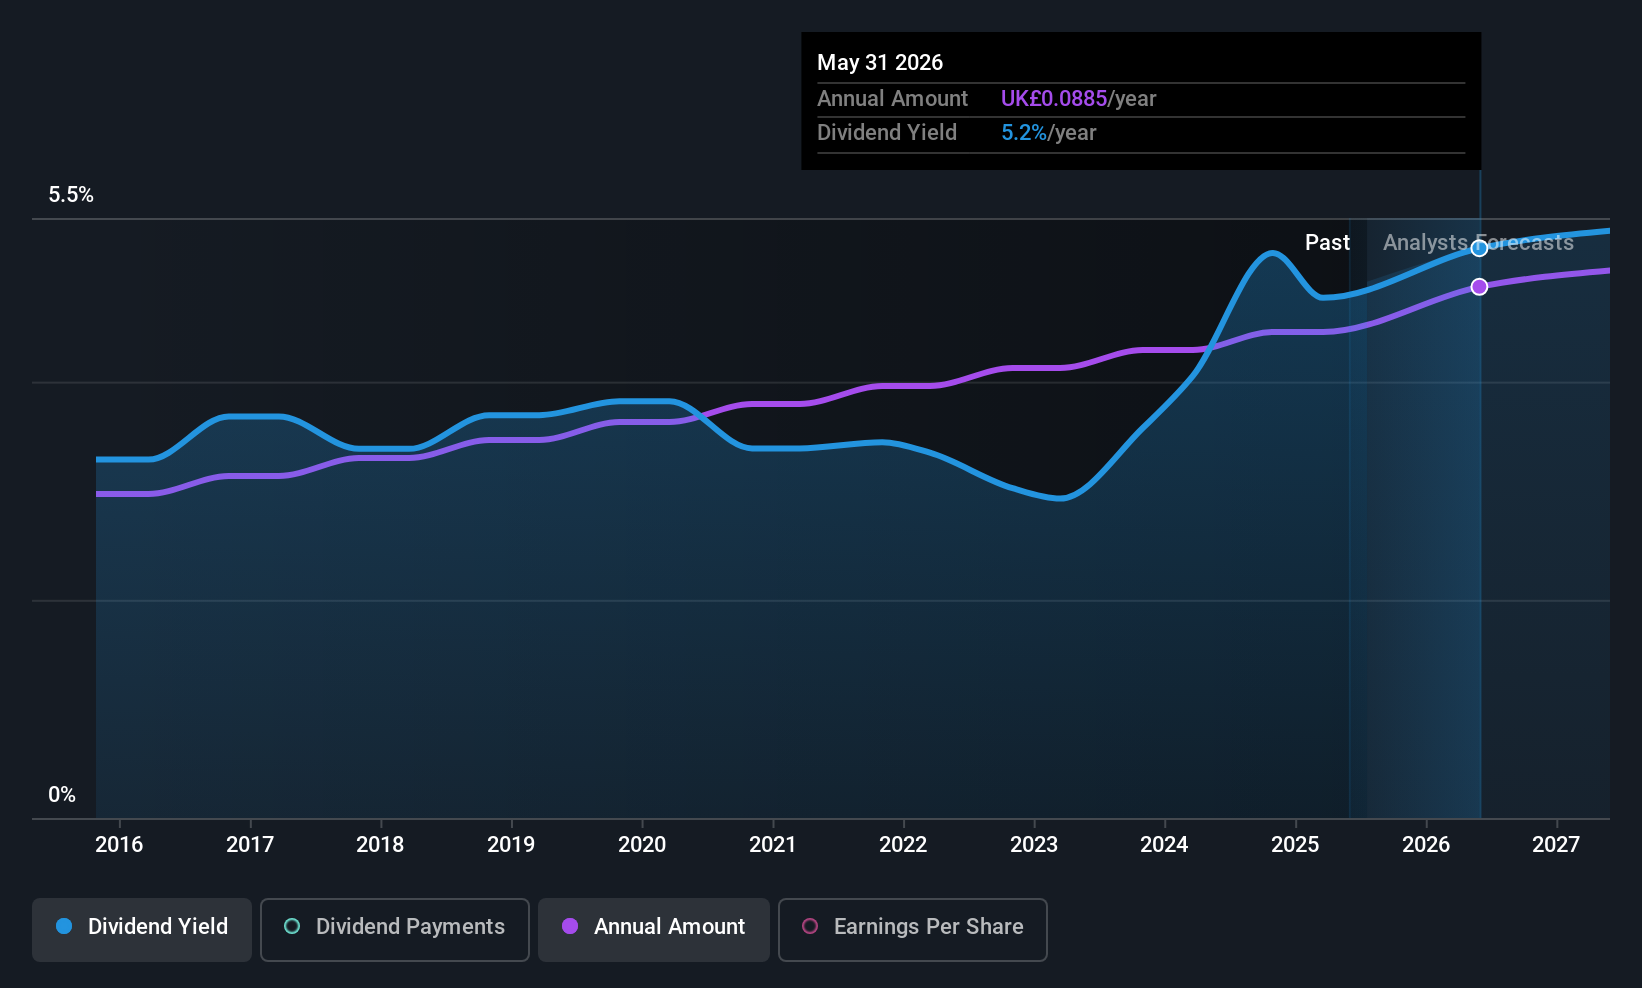
Drax Group (LSE:DRX)
Simply Wall St Dividend Rating: ★★★★☆☆
Overview: Drax Group plc, along with its subsidiaries, focuses on renewable power generation in the United Kingdom and has a market cap of £2.26 billion.
Operations: Drax Group plc's revenue is derived from several segments: Energy Solutions (£3.14 billion), Pellet Production (£948.80 million), Biomass Generation (£4.58 billion), and Flexible Generation (£191.10 million).
Dividend Yield: 4.2%
Drax Group's dividends are well-covered by earnings and cash flows, with payout ratios of 24.7% and 18.5%, respectively, but have been volatile over the past decade. Despite a recent decline in sales and net income for H1 2025, Drax increased its dividend by 11.5% to 29 pence per share for the year, maintaining a sustainable growth policy. The company recently completed a significant share buyback program worth £290.5 million, enhancing shareholder value amidst high debt levels.
- Dive into the specifics of Drax Group here with our thorough dividend report.
- The valuation report we've compiled suggests that Drax Group's current price could be quite moderate.

Macfarlane Group (LSE:MACF)
Simply Wall St Dividend Rating: ★★★★☆☆
Overview: Macfarlane Group PLC, with a market cap of £148.55 million, designs, manufactures, and distributes protective packaging products to businesses in the United Kingdom and Europe through its subsidiaries.
Operations: Macfarlane Group PLC generates its revenue primarily from Packaging Distribution (£228.28 million) and Manufacturing Operations (£65.34 million).
Dividend Yield: 3.9%
Macfarlane Group's interim dividend of 0.96 pence per share remains unchanged despite a drop in net income to £3.7 million for H1 2025 from £7.24 million a year prior, highlighting its commitment to shareholder returns. The dividend is well-covered by earnings and cash flows, with payout ratios of 48.6% and 27.8%, respectively, though the company's dividend history has been unstable and volatile over the past decade, limiting its appeal among top-tier UK dividend stocks.
- Click to explore a detailed breakdown of our findings in Macfarlane Group's dividend report.
- According our valuation report, there's an indication that Macfarlane Group's share price might be on the cheaper side.

Seize The Opportunity
- Unlock our comprehensive list of 53 Top UK Dividend Stocks by clicking here.
- Are any of these part of your asset mix? Tap into the analytical power of Simply Wall St's portfolio to get a 360-degree view on how they're shaping up.
- Maximize your investment potential with Simply Wall St, the comprehensive app that offers global market insights for free.
Looking For Alternative Opportunities?
- Explore high-performing small cap companies that haven't yet garnered significant analyst attention.
- Fuel your portfolio with companies showing strong growth potential, backed by optimistic outlooks both from analysts and management.
- Find companies with promising cash flow potential yet trading below their fair value.
This article by Simply Wall St is general in nature. We provide commentary based on historical data and analyst forecasts only using an unbiased methodology and our articles are not intended to be financial advice. It does not constitute a recommendation to buy or sell any stock, and does not take account of your objectives, or your financial situation. We aim to bring you long-term focused analysis driven by fundamental data. Note that our analysis may not factor in the latest price-sensitive company announcements or qualitative material. Simply Wall St has no position in any stocks mentioned.
New: Manage All Your Stock Portfolios in One Place
We've created the ultimate portfolio companion for stock investors, and it's free.
• Connect an unlimited number of Portfolios and see your total in one currency
• Be alerted to new Warning Signs or Risks via email or mobile
• Track the Fair Value of your stocks
Have feedback on this article? Concerned about the content? Get in touch with us directly. Alternatively, email editorial-team@simplywallst.com
About LSE:DRX
Undervalued with excellent balance sheet and pays a dividend.
Market Insights

Advertisement
Community Narratives
MINISO's fair value is projected at 26.69 with an anticipated PE ratio shift of 20x
Fair Value US$24.03|9.0% undervalued
BE
Community Contributor
Procter & Gamble: A Dividend Giant Facing Slowing Growth
Fair Value US$119.81|23.5% overvalued
AN
Community Contributor
Eli Lilly's Future Growth Driven by Tirzepatide and Favorable Market Conditions
Fair Value US$1.19k|14.4% undervalued
EA
Community Contributor