Advertisement
- France
- /
- Telecom Services and Carriers
- /
- ENXTPA:ORA
Orange (ENXTPA:ORA): Assessing Valuation After Recent Share Price Gains

Simply Wall St
Reviewed by Kshitija Bhandaru
Orange (ENXTPA:ORA) shares have been quietly edging higher over the past month. This has drawn attention from investors interested in the telecom sector’s stability and yield. Recent movement prompts a closer look at what might be driving sentiment.
See our latest analysis for Orange.
Orange’s 44.5% year-to-date share price return easily outpaces most blue-chip peers, which suggests investors are warming to its improving fundamentals and perceived resilience. Looking further back, its five-year total shareholder return of 113% shows steady long-term gains as momentum has gradually shifted in its favor.
If Orange’s recent run has you wondering what else could surprise, now is a great time to broaden your search and discover fast growing stocks with high insider ownership
With Orange’s strong rally and solid long-term returns, the question facing investors now is clear: is the current share price leaving room for upside or is all the anticipated growth already reflected in the valuation?
Price-to-Earnings of 40.9x: Is it justified?
Orange is currently trading with a Price-to-Earnings (P/E) ratio of 40.9x, markedly higher than both its immediate peers and the broader European Telecom industry averages. With the stock recently closing at €14.02, the lofty P/E suggests a rich valuation by market standards.
The P/E ratio measures how much investors are willing to pay today for a euro of Orange's earnings. For telecom companies, which typically have steady but moderate growth profiles, the P/E is a useful guide to how the market values current and future profitability. In Orange's case, such a high multiple implies that investors may be pricing in future profit growth, operational stability, or the appeal of its strong shareholder returns.
Compared to its peer average P/E of just 17.7x, Orange's multiple stands out as significantly more expensive. This is not an isolated comparison; the broader European Telecom industry also averages 17.7x. This further highlights the premium at which Orange trades. It is important to consider whether this premium is warranted by the company's growth outlook or market position.
See what the numbers say about this price — find out in our valuation breakdown.
Result: Price-to-Earnings of 40.9x (OVERVALUED)
However, slowing revenue growth or a reversal in net income gains could challenge the bullish outlook and prompt investors to rethink Orange’s elevated valuation.
Find out about the key risks to this Orange narrative.
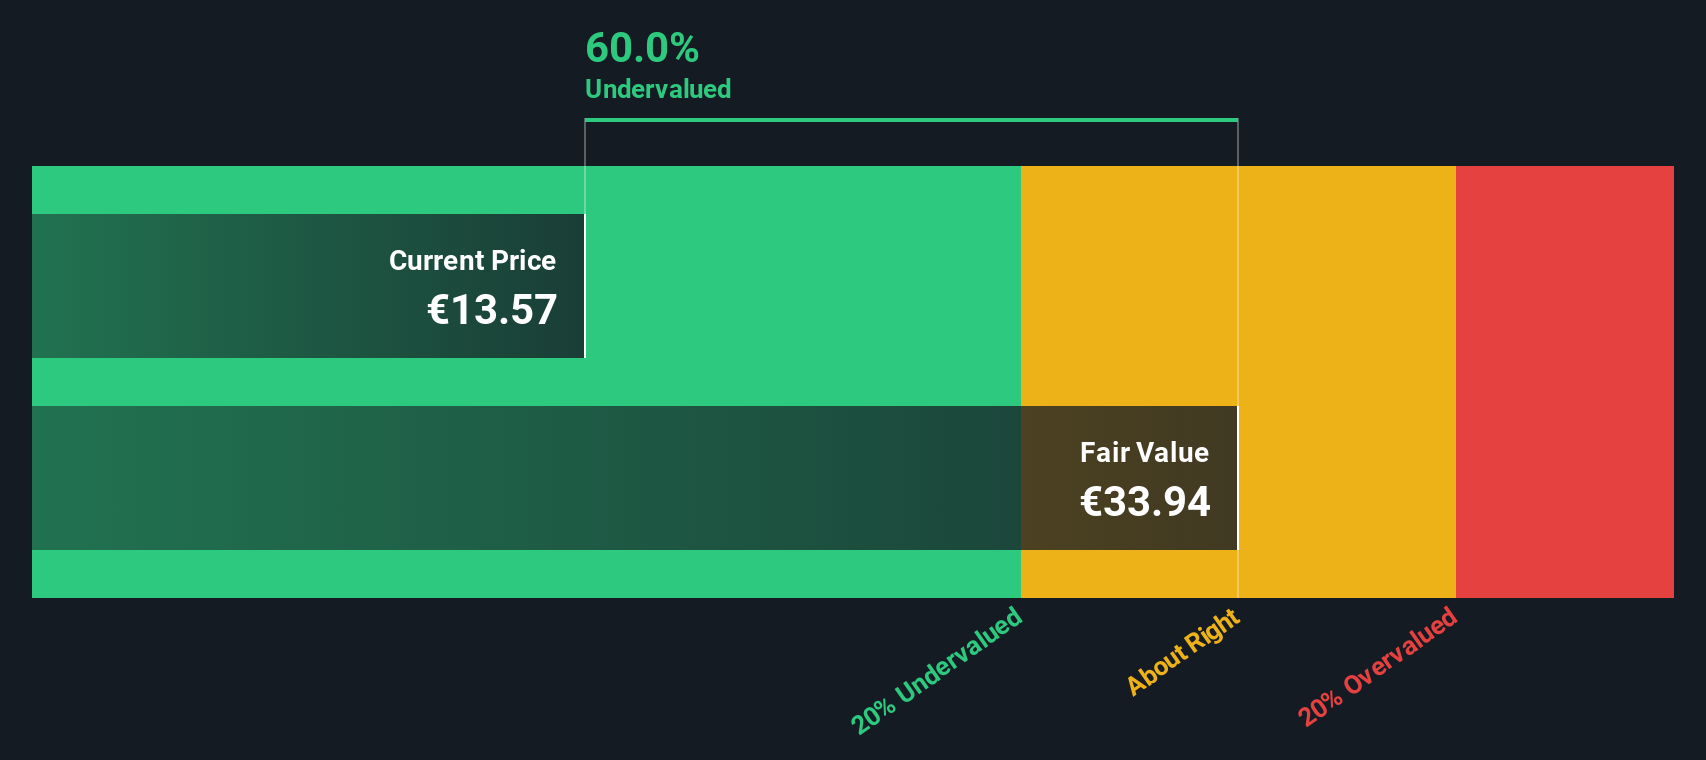
Another View: SWS DCF Model Sees Significant Upside
Despite Orange’s high price tag based on earnings, the SWS DCF model offers a very different perspective. According to our DCF estimate, Orange is trading at €14.02, which is nearly 59% below its calculated fair value of €34.03. This suggests substantial undervaluation if the growth and cash flow projections hold true. Could the market be overlooking Orange’s long-term potential?
Look into how the SWS DCF model arrives at its fair value.
Simply Wall St performs a discounted cash flow (DCF) on every stock in the world every day (check out Orange for example). We show the entire calculation in full. You can track the result in your watchlist or portfolio and be alerted when this changes, or use our stock screener to discover undervalued stocks based on their cash flows. If you save a screener we even alert you when new companies match - so you never miss a potential opportunity.
Build Your Own Orange Narrative
If you see things differently or want to dive deeper into the numbers yourself, you can craft your own Orange story in just a few minutes. Do it your way.
A great starting point for your Orange research is our analysis highlighting 2 key rewards and 3 important warning signs that could impact your investment decision.
Looking for more investment ideas?
There is a world of potential beyond Orange, with opportunities unfolding every day. Start your next search and position yourself ahead of the crowd today.
- Tap into rapid growth by checking out these 24 AI penny stocks, featuring innovators driving artificial intelligence breakthroughs across industries.
- Secure stable income with these 18 dividend stocks with yields > 3%, a handpicked collection of stocks offering yields above 3% to strengthen your portfolio.
- Stay ahead in the digital finance revolution through these 79 cryptocurrency and blockchain stocks, where companies are pioneering advancements in blockchain and cryptocurrency technology.
This article by Simply Wall St is general in nature. We provide commentary based on historical data and analyst forecasts only using an unbiased methodology and our articles are not intended to be financial advice. It does not constitute a recommendation to buy or sell any stock, and does not take account of your objectives, or your financial situation. We aim to bring you long-term focused analysis driven by fundamental data. Note that our analysis may not factor in the latest price-sensitive company announcements or qualitative material. Simply Wall St has no position in any stocks mentioned.
New: AI Stock Screener & Alerts
Our new AI Stock Screener scans the market every day to uncover opportunities.
• Dividend Powerhouses (3%+ Yield)
• Undervalued Small Caps with Insider Buying
• High growth Tech and AI Companies
Or build your own from over 50 metrics.
Have feedback on this article? Concerned about the content? Get in touch with us directly. Alternatively, email editorial-team@simplywallst.com
About ENXTPA:ORA
Orange
Operates as a telecommunications operator in France and internationally.
Moderate growth potential with mediocre balance sheet.
Similar Companies
Market Insights

Advertisement
Community Narratives
A formidable player in AI and enterprise computing.
Fair Value US$210.00|13.6% overvalued
CO
Community Contributor
IREN's Bold Moves in Sustainable Bitcoin Mining & AI Data Centers
Fair Value US$89.00|23.6% undervalued
BL
Community Contributor
Cooling the Champions: The Aussie Tech Behind F1's Victories
Fair Value AU$12.40|40.6% undervalued
TR
Community Contributor