Advertisement
David Iben put it well when he said, 'Volatility is not a risk we care about. What we care about is avoiding the permanent loss of capital.' When we think about how risky a company is, we always like to look at its use of debt, since debt overload can lead to ruin. As with many other companies Axway Software SA (EPA:AXW) makes use of debt. But the more important question is: how much risk is that debt creating?
Why Does Debt Bring Risk?
Debt assists a business until the business has trouble paying it off, either with new capital or with free cash flow. Ultimately, if the company can't fulfill its legal obligations to repay debt, shareholders could walk away with nothing. However, a more frequent (but still costly) occurrence is where a company must issue shares at bargain-basement prices, permanently diluting shareholders, just to shore up its balance sheet. Having said that, the most common situation is where a company manages its debt reasonably well - and to its own advantage. When we think about a company's use of debt, we first look at cash and debt together.
View our latest analysis for Axway Software
How Much Debt Does Axway Software Carry?
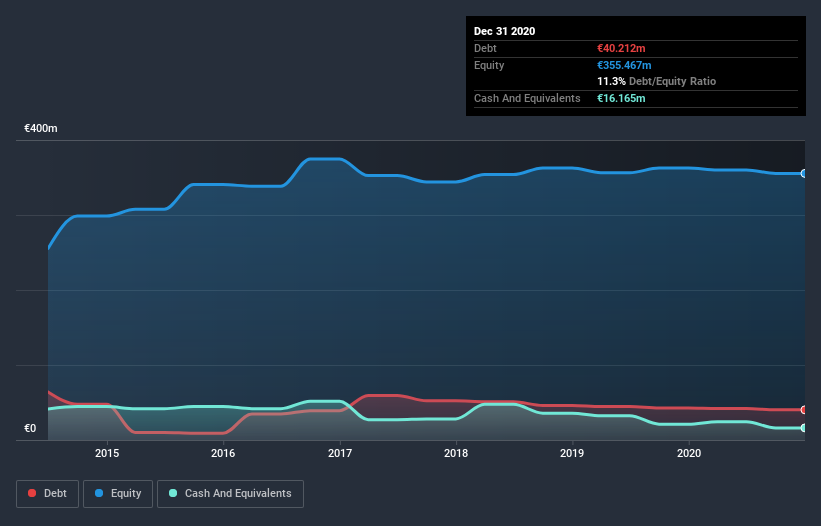
The image below, which you can click on for greater detail, shows that Axway Software had debt of €40.2m at the end of December 2020, a reduction from €42.7m over a year. However, it does have €16.2m in cash offsetting this, leading to net debt of about €24.0m.
A Look At Axway Software's Liabilities
The latest balance sheet data shows that Axway Software had liabilities of €121.4m due within a year, and liabilities of €82.5m falling due after that. Offsetting this, it had €16.2m in cash and €107.5m in receivables that were due within 12 months. So its liabilities total €80.2m more than the combination of its cash and short-term receivables.
Of course, Axway Software has a market capitalization of €588.0m, so these liabilities are probably manageable. Having said that, it's clear that we should continue to monitor its balance sheet, lest it change for the worse.
In order to size up a company's debt relative to its earnings, we calculate its net debt divided by its earnings before interest, tax, depreciation, and amortization (EBITDA) and its earnings before interest and tax (EBIT) divided by its interest expense (its interest cover). The advantage of this approach is that we take into account both the absolute quantum of debt (with net debt to EBITDA) and the actual interest expenses associated with that debt (with its interest cover ratio).
Axway Software's net debt is only 0.78 times its EBITDA. And its EBIT easily covers its interest expense, being 12.4 times the size. So we're pretty relaxed about its super-conservative use of debt. Another good sign is that Axway Software has been able to increase its EBIT by 25% in twelve months, making it easier to pay down debt. When analysing debt levels, the balance sheet is the obvious place to start. But ultimately the future profitability of the business will decide if Axway Software can strengthen its balance sheet over time. So if you're focused on the future you can check out this free report showing analyst profit forecasts.
Finally, a business needs free cash flow to pay off debt; accounting profits just don't cut it. So we clearly need to look at whether that EBIT is leading to corresponding free cash flow. During the last three years, Axway Software produced sturdy free cash flow equating to 59% of its EBIT, about what we'd expect. This cold hard cash means it can reduce its debt when it wants to.
Our View
Happily, Axway Software's impressive interest cover implies it has the upper hand on its debt. And the good news does not stop there, as its EBIT growth rate also supports that impression! Zooming out, Axway Software seems to use debt quite reasonably; and that gets the nod from us. While debt does bring risk, when used wisely it can also bring a higher return on equity. When analysing debt levels, the balance sheet is the obvious place to start. But ultimately, every company can contain risks that exist outside of the balance sheet. To that end, you should be aware of the 1 warning sign we've spotted with Axway Software .
Of course, if you're the type of investor who prefers buying stocks without the burden of debt, then don't hesitate to discover our exclusive list of net cash growth stocks, today.
If you’re looking to trade Axway Software, open an account with the lowest-cost* platform trusted by professionals, Interactive Brokers. Their clients from over 200 countries and territories trade stocks, options, futures, forex, bonds and funds worldwide from a single integrated account. Promoted
New: AI Stock Screener & Alerts
Our new AI Stock Screener scans the market every day to uncover opportunities.
• Dividend Powerhouses (3%+ Yield)
• Undervalued Small Caps with Insider Buying
• High growth Tech and AI Companies
Or build your own from over 50 metrics.
This article by Simply Wall St is general in nature. It does not constitute a recommendation to buy or sell any stock, and does not take account of your objectives, or your financial situation. We aim to bring you long-term focused analysis driven by fundamental data. Note that our analysis may not factor in the latest price-sensitive company announcements or qualitative material. Simply Wall St has no position in any stocks mentioned.
*Interactive Brokers Rated Lowest Cost Broker by StockBrokers.com Annual Online Review 2020
Have feedback on this article? Concerned about the content? Get in touch with us directly. Alternatively, email editorial-team (at) simplywallst.com.
About ENXTPA:74SW
74Software
Operates as a software company in France.
Very undervalued with solid track record.
Similar Companies
Market Insights


Advertisement
Weekly Picks
CE


Ceazar on Sparc AI ·
When GPS fails: this small cap is fixing a $54B drone problem
Fair Value:CA$5.2552.0% undervalued
121 followersusers have followed this narrative
0 commentsusers have commented on this narrative
25 likesusers have liked this narrative
BL


BlackGoat on IREN ·
IREN's Bold Moves in Sustainable Bitcoin Mining & AI Data Centers
Fair Value:US$71.4848.5% undervalued
222 followersusers have followed this narrative
9 commentsusers have commented on this narrative
33 likesusers have liked this narrative
HE


HedgeY on Arm Holdings ·
The Architecture Layer of AI Computing - But Priced Like the Future Already Arrived?
Fair Value:US$43044.3% undervalued
24 followersusers have followed this narrative
1 commentusers have commented on this narrative
7 likesusers have liked this narrative
HI


Hidden_Rock_Capital on Fiserv ·
Temporary "perfect storm" leads to opportunity to buy financial services leader for less than 5x long-term earnings
Fair Value:US$119.9955.0% undervalued
32 followersusers have followed this narrative
1 commentusers have commented on this narrative
10 likesusers have liked this narrative
Recently Updated Narratives
TR


tripledub on Microsoft ·
Everyone's Terrified Microsoft Will Keep Spending. I'm Terrified They'll Stop.
Fair Value:US$397.4116.9% overvalued
87 followersusers have followed this narrative
4 commentsusers have commented on this narrative
0 likesusers have liked this narrative
AL


alexandru_g3 on Alibaba Group Holding ·
One of the Most Mispriced Technology Ecosystems in the Market
Fair Value:US$241.9149.5% undervalued
1 followerusers have followed this narrative
0 commentsusers have commented on this narrative
0 likesusers have liked this narrative
AN

andre_santos on Microsoft ·
Microsoft - A Fundamental Valuation
Fair Value:US$507.348.4% undervalued
27 followersusers have followed this narrative
4 commentsusers have commented on this narrative
0 likesusers have liked this narrative
Popular Narratives
OS


oscargarcia on NVIDIA ·
The company that went from selling GPUs to gamers to becoming the AI arms dealer of the 21st century.
Fair Value:US$28028.3% undervalued
223 followersusers have followed this narrative
9 commentsusers have commented on this narrative
15 likesusers have liked this narrative
CU
CubanEros on Microsoft ·
A wonderful business at reasonable price.
Fair Value:US$419.9110.7% overvalued
101 followersusers have followed this narrative
0 commentsusers have commented on this narrative
7 likesusers have liked this narrative
TR

tripledub on Alphabet ·
Warren Buffett Just Bet $10 Billion on Google. The Catch? You May Already Be Too Late.
Fair Value:US$23054.8% overvalued
118 followersusers have followed this narrative
1 commentusers have commented on this narrative
18 likesusers have liked this narrative
Trending Discussion
GR
greg_xasak on Fiserv ·
As someone who has dealt directly with them as a CTO for a credit union, I have 8 years of horror stories about doing business with them. If there was any other competitor than could deliver 80% of Fiserv services, there would be a mad rush to migrate to them. They should thank their lucky stars they are a near monopoly. this industry is so ripe for a well funded competitor. Their integration of technology is awful, their ability to fix their own implementation screwups is sadly tragic. Sometimes they just silently kill support tickets without resolution and you never find out until you do a follow up inquiry. Why, because sometimes no one you are dealing with knows how to fix it and knows no one to ask for help. They can not meet their own implementation deadlines and sometimes there is no one on a technical team dealing with you that has any banking or credit union experience. The is an industry insider phrase when you meet other Fiserv customers called being "Fiserved". It means telling others of your worst stories of dealing with them. Ask around, all CTO's have some doozies.
1
|0

