Advertisement
- Sweden
- /
- Trade Distributors
- /
- OM:OEM B
Sidetrade And 2 Other Undiscovered Gems In Europe To Explore

Simply Wall St
Reviewed by Simply Wall St

As European markets experience a boost in sentiment following the de-escalation of trade tensions between the U.S. and China, with key indices like the STOXX Europe 600 Index rising by 2.10%, investors are increasingly looking for opportunities in the region's small-cap stocks. In this environment, identifying stocks that blend strong fundamentals with growth potential can be particularly rewarding, making companies like Sidetrade and others worth exploring for those seeking undiscovered gems in Europe's dynamic market landscape.
Top 10 Undiscovered Gems With Strong Fundamentals In Europe
| Name | Debt To Equity | Revenue Growth | Earnings Growth | Health Rating |
|---|---|---|---|---|
| AB Traction | NA | 5.39% | 5.24% | ★★★★★★ |
| Linc | NA | 101.28% | 29.81% | ★★★★★★ |
| La Forestière Equatoriale | NA | -65.30% | 37.55% | ★★★★★★ |
| Dekpol | 70.15% | 14.02% | 14.57% | ★★★★★☆ |
| Alantra Partners | 3.79% | -3.99% | -23.83% | ★★★★★☆ |
| Viohalco | 91.31% | 12.25% | 17.37% | ★★★★☆☆ |
| Evergent Investments | 5.59% | 5.88% | 16.36% | ★★★★☆☆ |
| Practic | 5.21% | 4.49% | 7.23% | ★★★★☆☆ |
| Castellana Properties Socimi | 53.49% | 6.64% | 21.96% | ★★★★☆☆ |
| Grenobloise d'Electronique et d'Automatismes Société Anonyme | 0.01% | 5.17% | -13.11% | ★★★★☆☆ |
We're going to check out a few of the best picks from our screener tool.
Sidetrade (ENXTPA:ALBFR)
Simply Wall St Value Rating: ★★★★★☆
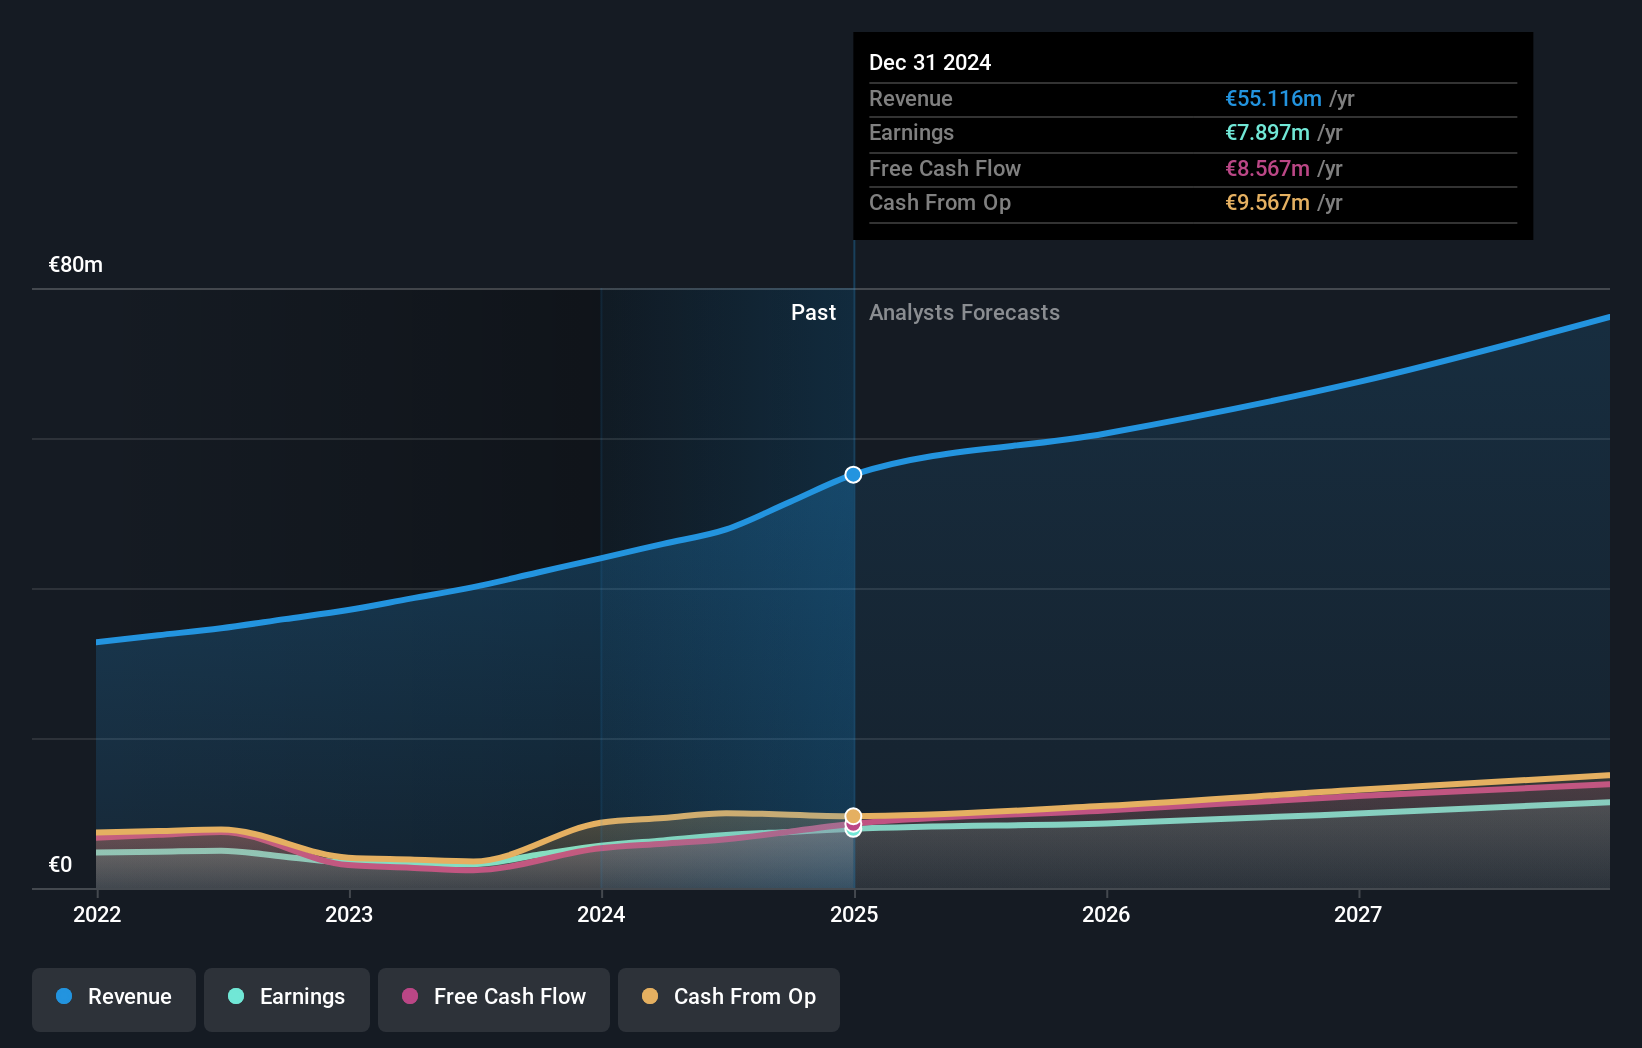
Overview: Sidetrade SA operates as a SaaS company in France and internationally, with a market cap of €372.74 million.
Operations: Sidetrade generates revenue primarily through its Software & Programming segment, amounting to €55.12 million. The company's market cap stands at €372.74 million.
Sidetrade, a nimble player in the European software scene, has shown impressive financial strength. With earnings growth of 40.4% last year and a net income rise to €7.9M from €5.63M, it's outpacing industry peers who grew at 9.8%. The company's interest payments are well covered by EBIT at 168 times, showcasing robust financial health. Additionally, its debt-to-equity ratio increased from 1.9% to 20% over five years but remains manageable due to more cash than total debt and positive free cash flow trends, suggesting that Sidetrade is navigating its growth phase with strategic acumen.
- Get an in-depth perspective on Sidetrade's performance by reading our health report here.
Review our historical performance report to gain insights into Sidetrade's's past performance.
engcon (OM:ENGCON B)
Simply Wall St Value Rating: ★★★★★★
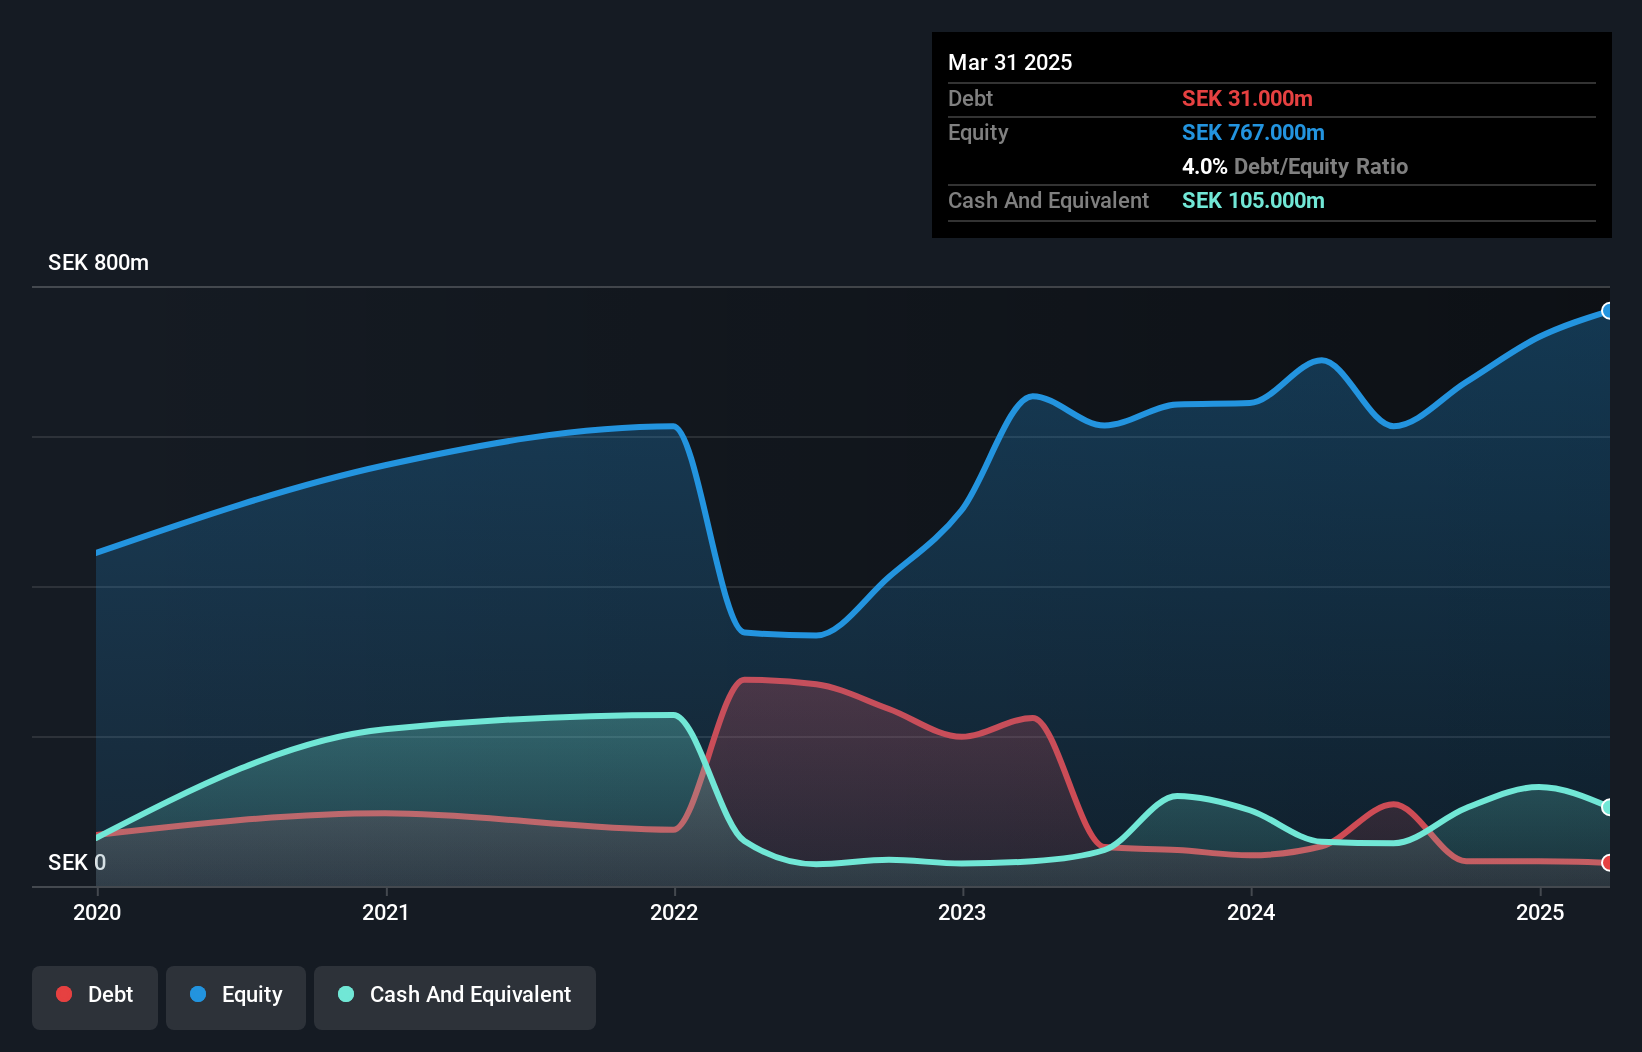
Overview: Engcon AB (publ) specializes in designing, producing, and selling excavator tools across various global markets including Europe, the Americas, Asia-Pacific regions, and holds a market cap of approximately SEK14.45 billion.
Operations: Engcon AB (publ) generates revenue primarily through its Construction Machinery & Equipment segment, which reported SEK1.70 billion. The company's cost structure and profitability are reflected in its financial performance, with a notable net profit margin trend that can provide insights into operational efficiency and market positioning.
Engcon, a notable player in the machinery sector, has been making waves with its strong financial footing and strategic maneuvers. Over the past year, earnings surged by 21.5%, outpacing the industry's 2.9% growth rate. The company's debt to equity ratio impressively decreased from 15.9% to 4% over five years, indicating prudent financial management. With EBIT covering interest payments at a robust 12.9 times and free cash flow consistently positive, Engcon's operations appear solidly grounded. Recent announcements include a dividend increase to SEK 1 per share and first-quarter sales of SEK 446 million, reflecting ongoing revenue momentum despite market challenges like currency fluctuations and competition pressures.
OEM International (OM:OEM B)
Simply Wall St Value Rating: ★★★★★★
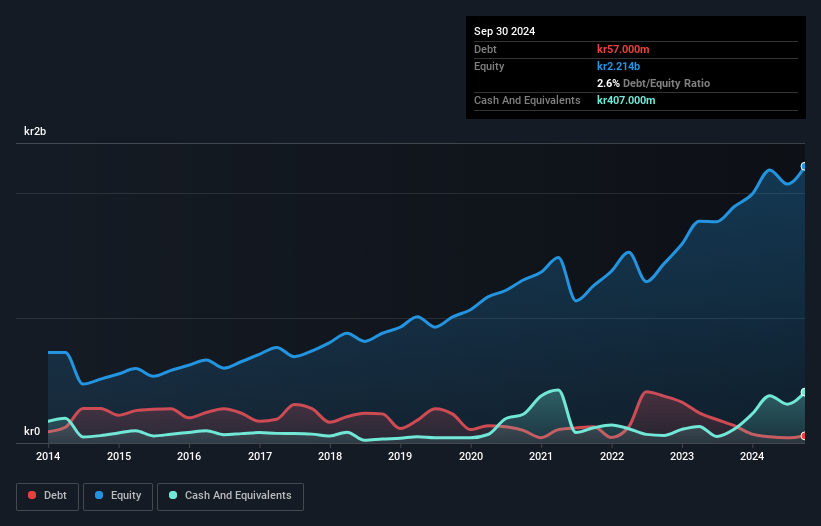
Overview: OEM International AB (publ) is a technology trading company operating through its subsidiaries, with a market cap of SEK19.24 billion.
Operations: OEM International generates revenue primarily through its technology trading activities. The company's financial performance is highlighted by a market capitalization of SEK19.24 billion, reflecting its scale in the industry.
OEM International has made significant strides in reducing its debt to equity ratio from 10.1% to 4.1% over five years, reflecting a solid financial footing. Despite a slight dip in net income for Q1 2025 at SEK 153 million compared to SEK 157 million the previous year, the company maintains high-quality earnings and robust free cash flow, which stood at SEK 787.4 million as of June 2024. With interest payments well-covered by EBIT at a ratio of 77x, OEM appears financially resilient amidst industry challenges and is poised for an anticipated revenue growth of around 8.51% annually.
- Click here and access our complete health analysis report to understand the dynamics of OEM International.
Examine OEM International's past performance report to understand how it has performed in the past.
Next Steps
- Discover the full array of 329 European Undiscovered Gems With Strong Fundamentals right here.
- Have you diversified into these companies? Leverage the power of Simply Wall St's portfolio to keep a close eye on market movements affecting your investments.
- Simply Wall St is your key to unlocking global market trends, a free user-friendly app for forward-thinking investors.
Curious About Other Options?
- Explore high-performing small cap companies that haven't yet garnered significant analyst attention.
- Fuel your portfolio with companies showing strong growth potential, backed by optimistic outlooks both from analysts and management.
- Find companies with promising cash flow potential yet trading below their fair value.
This article by Simply Wall St is general in nature. We provide commentary based on historical data and analyst forecasts only using an unbiased methodology and our articles are not intended to be financial advice. It does not constitute a recommendation to buy or sell any stock, and does not take account of your objectives, or your financial situation. We aim to bring you long-term focused analysis driven by fundamental data. Note that our analysis may not factor in the latest price-sensitive company announcements or qualitative material. Simply Wall St has no position in any stocks mentioned.
New: AI Stock Screener & Alerts
Our new AI Stock Screener scans the market every day to uncover opportunities.
• Dividend Powerhouses (3%+ Yield)
• Undervalued Small Caps with Insider Buying
• High growth Tech and AI Companies
Or build your own from over 50 metrics.
Have feedback on this article? Concerned about the content? Get in touch with us directly. Alternatively, email editorial-team@simplywallst.com
About OM:OEM B
Flawless balance sheet with acceptable track record.
Similar Companies
Market Insights

Advertisement
Community Narratives

Apple: A Dying Star with an Overpriced Valuation
Fair Value US$177.34|19.1% overvalued
IN
Community Contributor
Avino a case for USD$20 per share within 5 years (assuming $3,500 gold, $100 silver and $4 copper).
Fair Value CA$26.79|86.0% undervalued
AG
Community Contributor
Riding the Defense Boom RENK Sees Revenue Climb at 15% CAGR by FY 2029
Fair Value €69.87|14.3% undervalued
CH
Community Contributor