The past five years for Haulotte Group (EPA:PIG) investors has not been profitable


Generally speaking long term investing is the way to go. But unfortunately, some companies simply don't succeed. Zooming in on an example, the Haulotte Group SA (EPA:PIG) share price dropped 69% in the last half decade. That's an unpleasant experience for long term holders. And some of the more recent buyers are probably worried, too, with the stock falling 20% in the last year. Shareholders have had an even rougher run lately, with the share price down 18% in the last 90 days.
With that in mind, it's worth seeing if the company's underlying fundamentals have been the driver of long term performance, or if there are some discrepancies.
View our latest analysis for Haulotte Group
Because Haulotte Group made a loss in the last twelve months, we think the market is probably more focussed on revenue and revenue growth, at least for now. Generally speaking, companies without profits are expected to grow revenue every year, and at a good clip. As you can imagine, fast revenue growth, when maintained, often leads to fast profit growth.
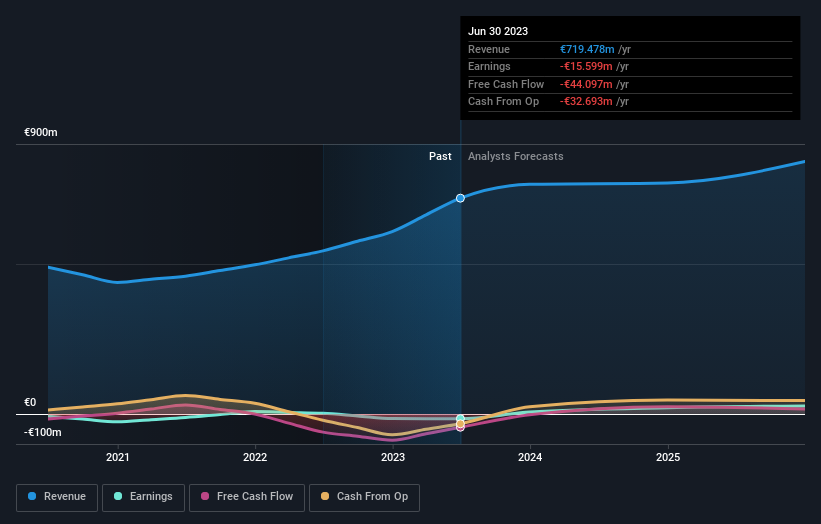
Over five years, Haulotte Group grew its revenue at 1.8% per year. That's not a very high growth rate considering it doesn't make profits. It's likely this weak growth has contributed to an annualised return of 11% for the last five years. We'd want to see proof that future revenue growth is likely to be significantly stronger before getting too interested in Haulotte Group. When a stock falls hard like this, some investors like to add the company to a watchlist (in case the business recovers, longer term).
The company's revenue and earnings (over time) are depicted in the image below (click to see the exact numbers).
This free interactive report on Haulotte Group's balance sheet strength is a great place to start, if you want to investigate the stock further.
A Dividend Lost
It's important to keep in mind that we've been talking about the share price returns, which don't include dividends, while the total shareholder return does. By accounting for the value of dividends paid, the TSR can be seen as a more complete measure of the value a company brings to its shareholders. Haulotte Group's TSR over the last 5 years is -64%; better than its share price return. Even though the company isn't paying dividends at the moment, it has done in the past.
A Different Perspective
Investors in Haulotte Group had a tough year, with a total loss of 20%, against a market gain of about 9.5%. However, keep in mind that even the best stocks will sometimes underperform the market over a twelve month period. Regrettably, last year's performance caps off a bad run, with the shareholders facing a total loss of 10% per year over five years. We realise that Baron Rothschild has said investors should "buy when there is blood on the streets", but we caution that investors should first be sure they are buying a high quality business. It's always interesting to track share price performance over the longer term. But to understand Haulotte Group better, we need to consider many other factors. For instance, we've identified 3 warning signs for Haulotte Group (1 can't be ignored) that you should be aware of.
If you are like me, then you will not want to miss this free list of growing companies that insiders are buying.
Please note, the market returns quoted in this article reflect the market weighted average returns of stocks that currently trade on French exchanges.
If you're looking to trade Haulotte Group, open an account with the lowest-cost platform trusted by professionals, Interactive Brokers.
With clients in over 200 countries and territories, and access to 160 markets, IBKR lets you trade stocks, options, futures, forex, bonds and funds from a single integrated account.
Enjoy no hidden fees, no account minimums, and FX conversion rates as low as 0.03%, far better than what most brokers offer.
Sponsored ContentValuation is complex, but we're here to simplify it.
Discover if Haulotte Group might be undervalued or overvalued with our detailed analysis, featuring fair value estimates, potential risks, dividends, insider trades, and its financial condition.
Access Free AnalysisHave feedback on this article? Concerned about the content? Get in touch with us directly. Alternatively, email editorial-team (at) simplywallst.com.
This article by Simply Wall St is general in nature. We provide commentary based on historical data and analyst forecasts only using an unbiased methodology and our articles are not intended to be financial advice. It does not constitute a recommendation to buy or sell any stock, and does not take account of your objectives, or your financial situation. We aim to bring you long-term focused analysis driven by fundamental data. Note that our analysis may not factor in the latest price-sensitive company announcements or qualitative material. Simply Wall St has no position in any stocks mentioned.
About ENXTPA:PIG
Haulotte Group
Through its subsidiaries, designs, manufactures, and markets people and material lifting equipment.
Solid track record and good value.
Similar Companies
Market Insights

Community Narratives
