
Advertisement
Alstom's (EPA:ALO) investors will be pleased with their notable 92% return over the last year

The simplest way to invest in stocks is to buy exchange traded funds. But one can do better than that by picking better than average stocks (as part of a diversified portfolio). For example, the Alstom SA (EPA:ALO) share price is up 81% in the last 1 year, clearly besting the market return of around 3.4% (not including dividends). So that should have shareholders smiling. Zooming out, the stock is actually down 16% in the last three years.
Now it's worth having a look at the company's fundamentals too, because that will help us determine if the long term shareholder return has matched the performance of the underlying business.
View our latest analysis for Alstom
In his essay The Superinvestors of Graham-and-Doddsville Warren Buffett described how share prices do not always rationally reflect the value of a business. One imperfect but simple way to consider how the market perception of a company has shifted is to compare the change in the earnings per share (EPS) with the share price movement.
During the last year, Alstom actually saw its earnings per share drop 111%. This was, in part, due to extraordinary items impacting earning in the last twelve months.
Given the share price gain, we doubt the market is measuring progress with EPS. Since the change in EPS doesn't seem to correlate with the change in share price, it's worth taking a look at other metrics.
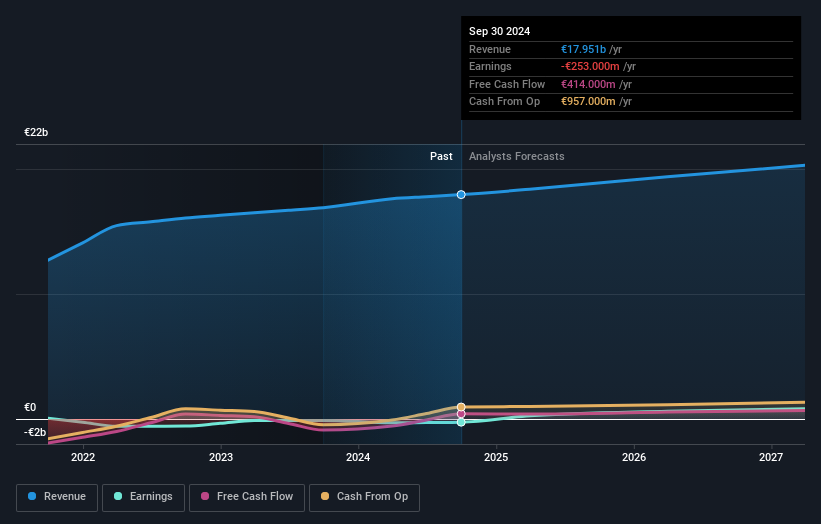
We think that the revenue growth of 6.2% could have some investors interested. We do see some companies suppress earnings in order to accelerate revenue growth.
The company's revenue and earnings (over time) are depicted in the image below (click to see the exact numbers).
We're pleased to report that the CEO is remunerated more modestly than most CEOs at similarly capitalized companies. But while CEO remuneration is always worth checking, the really important question is whether the company can grow earnings going forward. You can see what analysts are predicting for Alstom in this interactive graph of future profit estimates.
What About The Total Shareholder Return (TSR)?
Investors should note that there's a difference between Alstom's total shareholder return (TSR) and its share price change, which we've covered above. Arguably the TSR is a more complete return calculation because it accounts for the value of dividends (as if they were reinvested), along with the hypothetical value of any discounted capital that have been offered to shareholders. Alstom's TSR of 92% for the 1 year exceeded its share price return, because it has paid dividends.
A Different Perspective
It's good to see that Alstom has rewarded shareholders with a total shareholder return of 92% in the last twelve months. Notably the five-year annualised TSR loss of 8% per year compares very unfavourably with the recent share price performance. The long term loss makes us cautious, but the short term TSR gain certainly hints at a brighter future. It's always interesting to track share price performance over the longer term. But to understand Alstom better, we need to consider many other factors. To that end, you should be aware of the 1 warning sign we've spotted with Alstom .
If you are like me, then you will not want to miss this free list of undervalued small caps that insiders are buying.
Please note, the market returns quoted in this article reflect the market weighted average returns of stocks that currently trade on French exchanges.
New: Manage All Your Stock Portfolios in One Place
We've created the ultimate portfolio companion for stock investors, and it's free.
• Connect an unlimited number of Portfolios and see your total in one currency
• Be alerted to new Warning Signs or Risks via email or mobile
• Track the Fair Value of your stocks
Have feedback on this article? Concerned about the content? Get in touch with us directly. Alternatively, email editorial-team (at) simplywallst.com.
This article by Simply Wall St is general in nature. We provide commentary based on historical data and analyst forecasts only using an unbiased methodology and our articles are not intended to be financial advice. It does not constitute a recommendation to buy or sell any stock, and does not take account of your objectives, or your financial situation. We aim to bring you long-term focused analysis driven by fundamental data. Note that our analysis may not factor in the latest price-sensitive company announcements or qualitative material. Simply Wall St has no position in any stocks mentioned.
About ENXTPA:ALO
Alstom
Provides solutions for rail transport industry in Europe, the Americas, Asia and Pacific, the Middle East, Central Asia, and Africa.
Excellent balance sheet and fair value.
Similar Companies
Market Insights


Advertisement
Community Narratives

Quality Assets, Cautious Expansion and Commodity Super-cycle To Deliver Steady Revenue Growth 
Fair Value US$20.44|3.8% undervalued
ST
Equity Analyst and Writer
Tullow Oil's Share Price Could Soar Up to 135% if Oil Holds at $70
Fair Value UK£0.45|64.0% undervalued
OI
Community Contributor