
Advertisement
Société Générale Société anonyme (EPA:GLE) shareholders have endured a 0.5% loss from investing in the stock three years ago

In order to justify the effort of selecting individual stocks, it's worth striving to beat the returns from a market index fund. But if you try your hand at stock picking, you risk returning less than the market. We regret to report that long term Société Générale Société anonyme (EPA:GLE) shareholders have had that experience, with the share price dropping 16% in three years, versus a market return of about 17%.
So let's have a look and see if the longer term performance of the company has been in line with the underlying business' progress.
View our latest analysis for Société Générale Société anonyme
To paraphrase Benjamin Graham: Over the short term the market is a voting machine, but over the long term it's a weighing machine. One flawed but reasonable way to assess how sentiment around a company has changed is to compare the earnings per share (EPS) with the share price.
During the three years that the share price fell, Société Générale Société anonyme's earnings per share (EPS) dropped by 14% each year. This fall in the EPS is worse than the 6% compound annual share price fall. So the market may not be too worried about the EPS figure, at the moment -- or it may have previously priced some of the drop in.
The company's earnings per share (over time) is depicted in the image below (click to see the exact numbers).
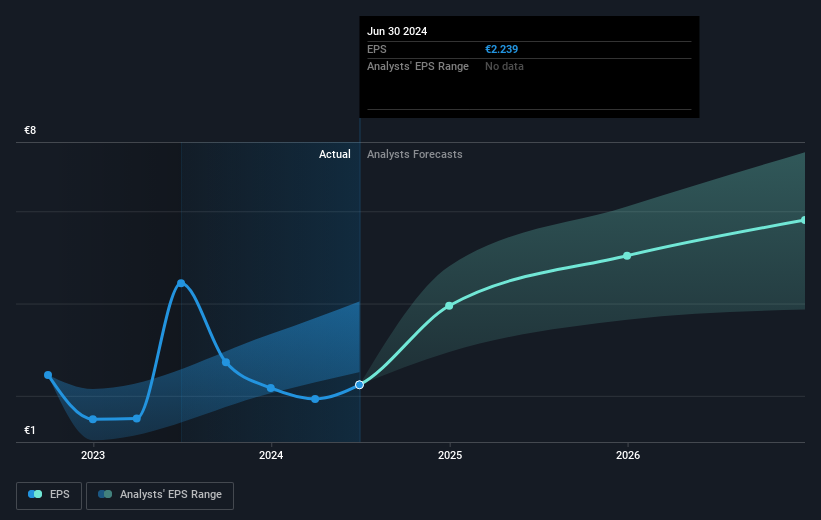
Dive deeper into Société Générale Société anonyme's key metrics by checking this interactive graph of Société Générale Société anonyme's earnings, revenue and cash flow.
What About Dividends?
When looking at investment returns, it is important to consider the difference between total shareholder return (TSR) and share price return. The TSR incorporates the value of any spin-offs or discounted capital raisings, along with any dividends, based on the assumption that the dividends are reinvested. Arguably, the TSR gives a more comprehensive picture of the return generated by a stock. We note that for Société Générale Société anonyme the TSR over the last 3 years was -0.5%, which is better than the share price return mentioned above. This is largely a result of its dividend payments!
A Different Perspective
Société Générale Société anonyme shareholders gained a total return of 2.5% during the year. But that return falls short of the market. On the bright side, the longer term returns (running at about 3% a year, over half a decade) look better. It's quite possible the business continues to execute with prowess, even as the share price gains are slowing. It's always interesting to track share price performance over the longer term. But to understand Société Générale Société anonyme better, we need to consider many other factors. Take risks, for example - Société Générale Société anonyme has 2 warning signs we think you should be aware of.
We will like Société Générale Société anonyme better if we see some big insider buys. While we wait, check out this free list of undervalued stocks (mostly small caps) with considerable, recent, insider buying.
Please note, the market returns quoted in this article reflect the market weighted average returns of stocks that currently trade on French exchanges.
New: Manage All Your Stock Portfolios in One Place
We've created the ultimate portfolio companion for stock investors, and it's free.
• Connect an unlimited number of Portfolios and see your total in one currency
• Be alerted to new Warning Signs or Risks via email or mobile
• Track the Fair Value of your stocks
Have feedback on this article? Concerned about the content? Get in touch with us directly. Alternatively, email editorial-team (at) simplywallst.com.
This article by Simply Wall St is general in nature. We provide commentary based on historical data and analyst forecasts only using an unbiased methodology and our articles are not intended to be financial advice. It does not constitute a recommendation to buy or sell any stock, and does not take account of your objectives, or your financial situation. We aim to bring you long-term focused analysis driven by fundamental data. Note that our analysis may not factor in the latest price-sensitive company announcements or qualitative material. Simply Wall St has no position in any stocks mentioned.
About ENXTPA:GLE
Société Générale Société anonyme
Provides banking and financial services to individuals, corporates, and institutional clients in Europe and internationally.
Solid track record with mediocre balance sheet.
Similar Companies
Market Insights

Advertisement
Community Narratives

BMW cruising ahead with new EVs and premium models to boost revenue 5%
Fair Value €135.07|45.0% undervalued
UN
Community Contributor
EU#2 - From Humble Beginnings to Global Powerhouse
Fair Value DKK 851.04|48.9% undervalued
TO
Community Contributor