- Spain
- /
- Electric Utilities
- /
- BME:IBE
Is Iberdrola’s Stock Rally Justified After Recent Q1 Earnings Beat?

Reviewed by Bailey Pemberton
If you are on the fence about Iberdrola stock right now, you are definitely not alone. With shares advancing 2.0% in just the past week and boasting a year-to-date return of 18.6%, it is no wonder investors are taking a closer look. The past year’s impressive 21.7% gain, and a staggering 85.3% rise over the last three years, have made this Spanish utility a standout on European markets. Market optimism has only grown as renewables continue to play a bigger role in global energy transitions. This has sent shares higher and may be shifting how investors think about risk and reward with Iberdrola.
But does that track record of strong performance mean the stock is a bargain, or has the market already priced in the optimism? To put things in perspective, when we run Iberdrola through six widely used valuation checks, it does not appear undervalued in any of them, scoring 0 out of 6 on our value scorecard. That might surprise some, given its steady ascent, so it is definitely worth a closer look.
Up next, let’s break down these common valuation approaches and see how Iberdrola stacks up. And if you are looking for more than just the numbers, stick around. A smarter, more holistic way to value the company might just change how you see the stock.
Iberdrola scores just 0/6 on our valuation checks. See what other red flags we found in the full valuation breakdown.
Approach 1: Iberdrola Discounted Cash Flow (DCF) Analysis
The Discounted Cash Flow (DCF) model estimates a company’s true worth by projecting its future cash flows and discounting them back to today’s value. This approach gives investors an idea of the “intrinsic” share price based on expected profitability.
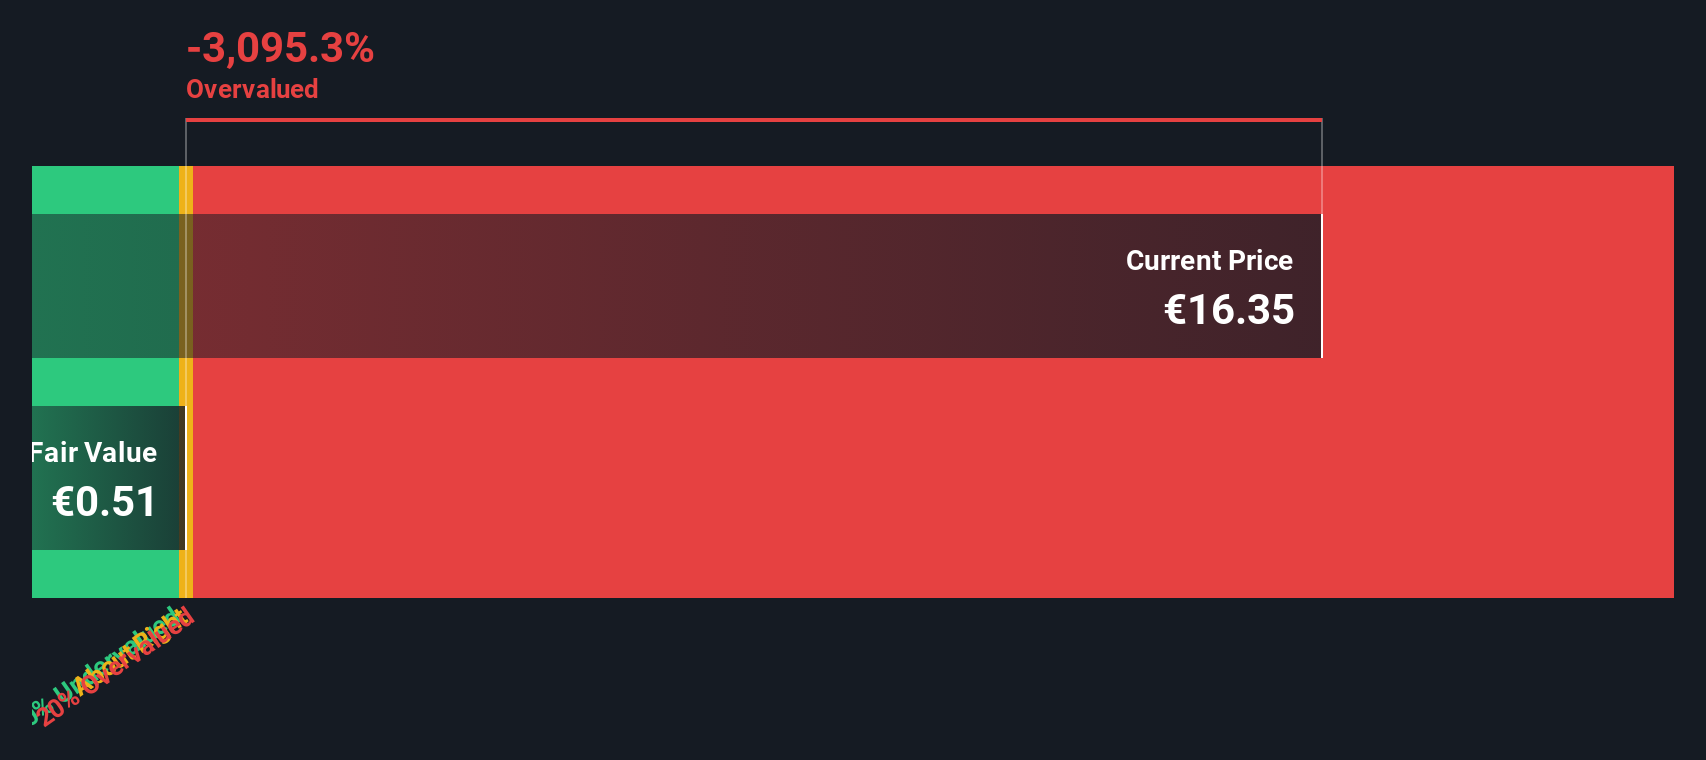
For Iberdrola, the DCF model uses its most recent Free Cash Flow of €5.1 billion and analyst growth forecasts for the next five years. Beyond that, future values are extrapolated to cover a full decade. According to current projections, Iberdrola is expected to generate just €321 million in Free Cash Flow by 2027. The estimates for years further out decline steadily, reaching around €65.9 million by 2035. All figures are in euros.
Based on these projections, the model calculates an intrinsic fair value of €0.51 per share. This implies the stock is trading at a massive 3047.4% premium to its DCF-based fair value. This suggests that Iberdrola’s share price is far above what its future cash generation alone would justify.
Result: OVERVALUED
Our Discounted Cash Flow (DCF) analysis suggests Iberdrola may be overvalued by 3047.4%. Find undervalued stocks or create your own screener to find better value opportunities.
Approach 2: Iberdrola Price vs Earnings (P/E Ratio)
The price-to-earnings (P/E) ratio is a popular metric for evaluating profitable companies because it directly relates a company’s share price to its earnings. For investors, it offers a quick snapshot of what the market is willing to pay for each euro of current earnings. This makes it especially useful for established businesses like Iberdrola.
A “normal” or fair P/E ratio is not set in stone. Higher growth expectations or lower risk typically justify a premium P/E, while slow growth or greater risks push the “right” multiple lower. That is why it is important to see how Iberdrola compares on this metric versus its key benchmarks.
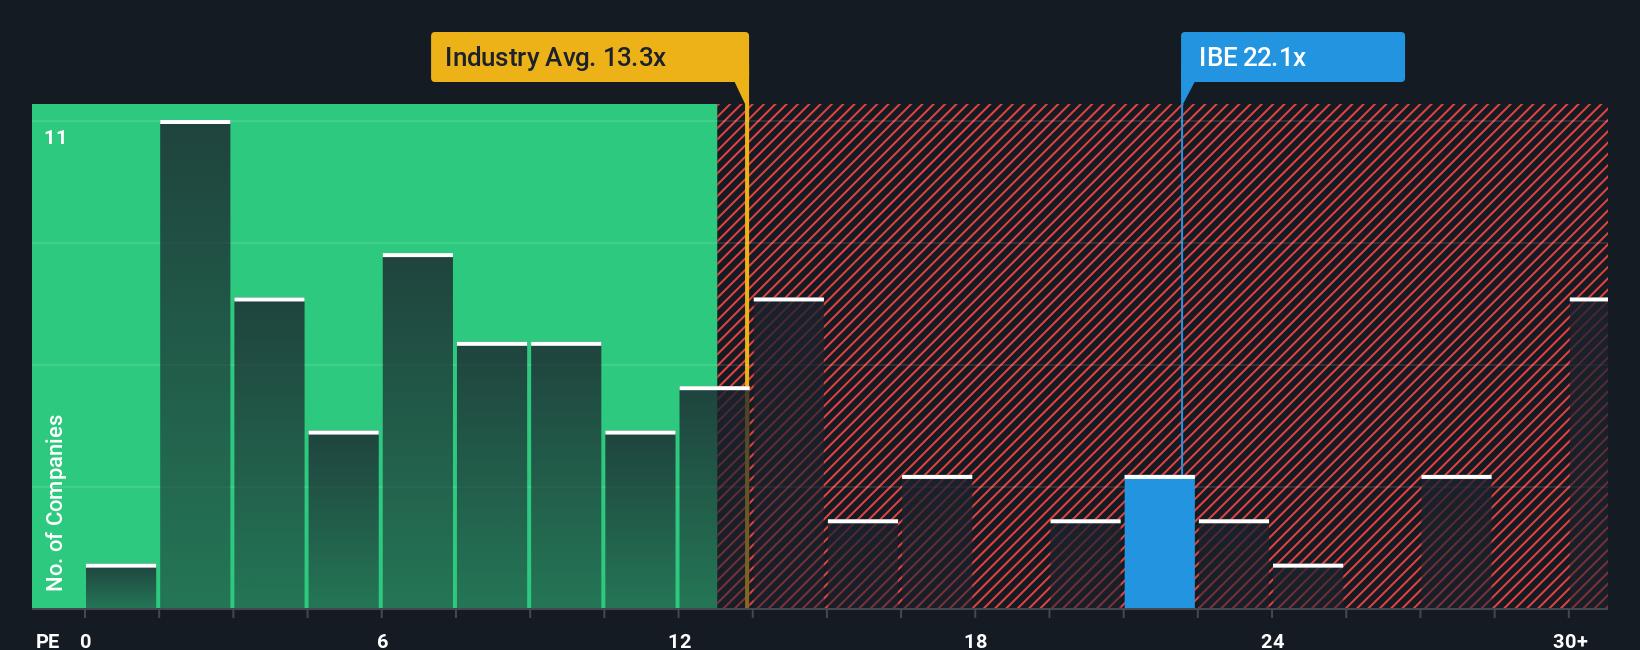
Iberdrola currently trades on a P/E ratio of 21.60x. That is noticeably higher than both the industry average of 14.62x and its peer average of 13.69x. However, Simply Wall St’s proprietary Fair Ratio is a forward-looking gauge that adjusts for the company’s earnings growth, margins, scale, risk profile, and industry, and comes in at 20.78x for Iberdrola. The Fair Ratio incorporates more factors than a simple comparison with peers or sector averages, making it a more holistic guide to value.
Since Iberdrola’s actual P/E is only marginally above the Fair Ratio, the stock appears to be about right on this measure.
Result: ABOUT RIGHT
PE ratios tell one story, but what if the real opportunity lies elsewhere? Discover companies where insiders are betting big on explosive growth.
Upgrade Your Decision Making: Choose your Iberdrola Narrative
Earlier, we mentioned that there is an even better way to understand valuation, so let us introduce you to Narratives. A Narrative is a simple and powerful way to express your perspective on a company by connecting its story—what you believe about its future—with your own forecasts for revenue, earnings, and profit margins. Instead of just focusing on traditional ratios or analyst targets, Narratives help you turn these beliefs into a clear, calculated fair value.
Narratives are easy to use and accessible on Simply Wall St’s Community page, a platform relied on by millions of investors. With Narratives, you link your outlook on Iberdrola, such as expected growth from US and UK grid investments or risks from political and regulatory changes, to your forecasts and see how those assumptions translate into a fair value per share.
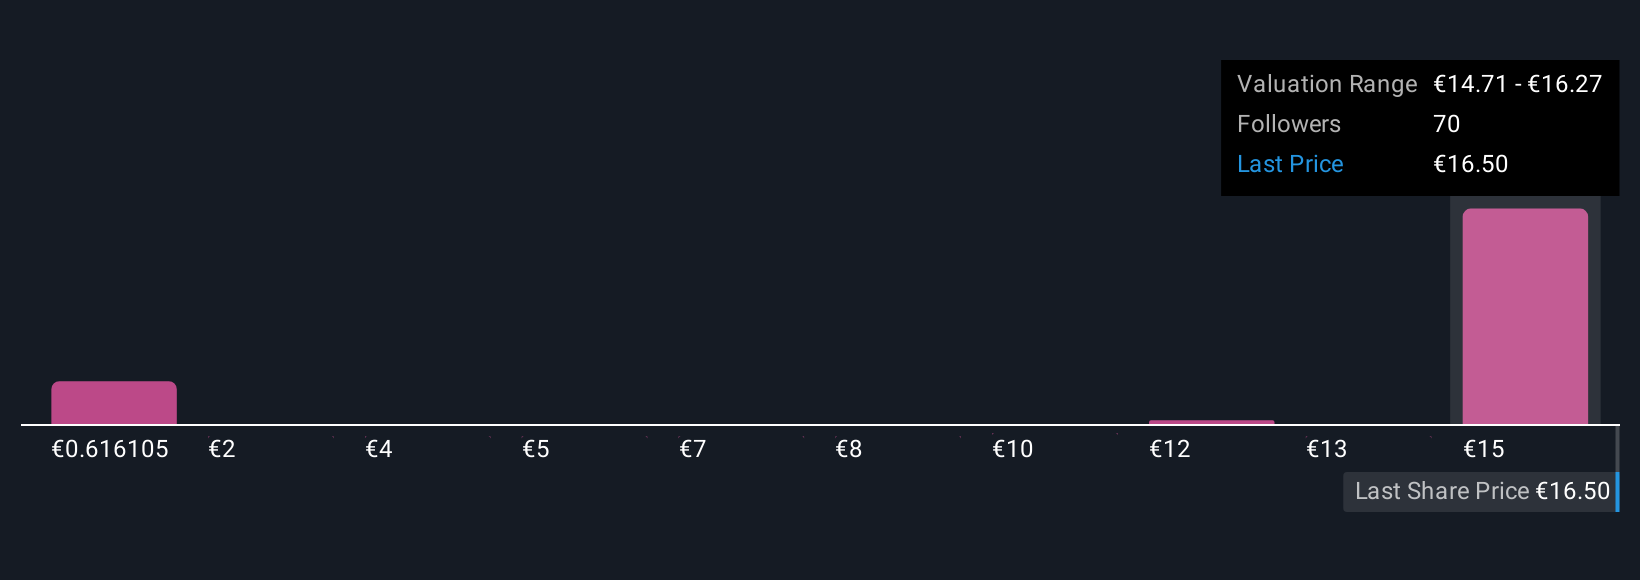
This approach lets you compare your own estimate of fair value to the current share price, so you can decide if now is the right time to buy, hold, or sell. Plus, Narratives update automatically as news, earnings, or financials change, keeping your investment view up to date in real time. For example, some investors see a bullish future for Iberdrola, placing its fair value as high as €18.5, while more cautious perspectives set it as low as €9.7. This illustrates how much your story shapes your view of the stock.
Do you think there's more to the story for Iberdrola? Create your own Narrative to let the Community know!
This article by Simply Wall St is general in nature. We provide commentary based on historical data and analyst forecasts only using an unbiased methodology and our articles are not intended to be financial advice. It does not constitute a recommendation to buy or sell any stock, and does not take account of your objectives, or your financial situation. We aim to bring you long-term focused analysis driven by fundamental data. Note that our analysis may not factor in the latest price-sensitive company announcements or qualitative material. Simply Wall St has no position in any stocks mentioned.
Mobile Infrastructure for Defense and Disaster
The next wave in robotics isn't humanoid. Its fully autonomous towers delivering 5G, ISR, and radar in under 30 minutes, anywhere.
Get the investor briefing before the next round of contracts
Sponsored On Behalf of CiTechNew: AI Stock Screener & Alerts
Our new AI Stock Screener scans the market every day to uncover opportunities.
• Dividend Powerhouses (3%+ Yield)
• Undervalued Small Caps with Insider Buying
• High growth Tech and AI Companies
Or build your own from over 50 metrics.
Have feedback on this article? Concerned about the content? Get in touch with us directly. Alternatively, email editorial-team@simplywallst.com
About BME:IBE
Iberdrola
Engages in the generation, production, transmission, distribution, and supply of electricity in Spain, the United Kingdom, the United States, Mexico, Brazil, Germany, France, and Australia.
Average dividend payer with mediocre balance sheet.
Similar Companies
Market Insights

Weekly Picks

THE KINGDOM OF BROWN GOODS: WHY MGPI IS BEING CRUSHED BY INVENTORY & PRIMED FOR RESURRECTION


Why Vertical Aerospace (NYSE: EVTL) is Worth Possibly Over 13x its Current Price


The Quiet Giant That Became AI’s Power Grid
Recently Updated Narratives

Butler National (Buks) outperforms.


A tech powerhouse quietly powering the world’s AI infrastructure.


Keppel DC REIT (SGX: AJBU) is a resilient gem in the data center space.
Popular Narratives

MicroVision will explode future revenue by 380.37% with a vision towards success


Crazy Undervalued 42 Baggers Silver Play (Active & Running Mine)


