
Advertisement
Key Insights
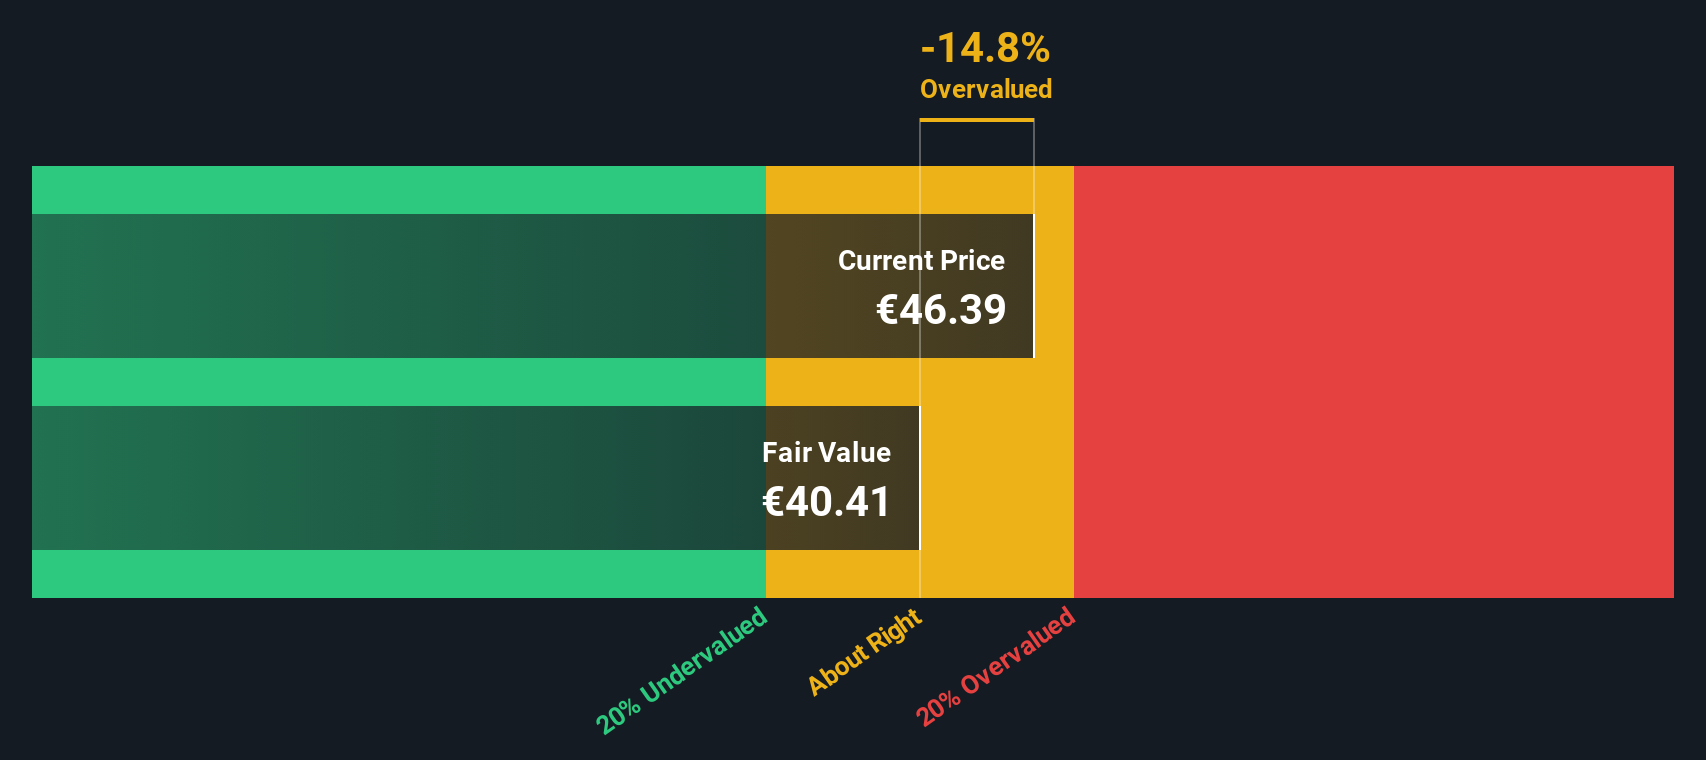
- The projected fair value for Ferrovial is €40.41 based on 2 Stage Free Cash Flow to Equity
- Current share price of €46.39 suggests Ferrovial is potentially trading close to its fair value
- Analyst price target for FER is €46.99, which is 16% above our fair value estimate
Today we will run through one way of estimating the intrinsic value of Ferrovial SE (BME:FER) by taking the forecast future cash flows of the company and discounting them back to today's value. One way to achieve this is by employing the Discounted Cash Flow (DCF) model. Before you think you won't be able to understand it, just read on! It's actually much less complex than you'd imagine.
Companies can be valued in a lot of ways, so we would point out that a DCF is not perfect for every situation. Anyone interested in learning a bit more about intrinsic value should have a read of the Simply Wall St analysis model.
What's The Estimated Valuation?
We are going to use a two-stage DCF model, which, as the name states, takes into account two stages of growth. The first stage is generally a higher growth period which levels off heading towards the terminal value, captured in the second 'steady growth' period. In the first stage we need to estimate the cash flows to the business over the next ten years. Where possible we use analyst estimates, but when these aren't available we extrapolate the previous free cash flow (FCF) from the last estimate or reported value. We assume companies with shrinking free cash flow will slow their rate of shrinkage, and that companies with growing free cash flow will see their growth rate slow, over this period. We do this to reflect that growth tends to slow more in the early years than it does in later years.
A DCF is all about the idea that a dollar in the future is less valuable than a dollar today, and so the sum of these future cash flows is then discounted to today's value:
10-year free cash flow (FCF) forecast
| 2026 | 2027 | 2028 | 2029 | 2030 | 2031 | 2032 | 2033 | 2034 | 2035 | |
| Levered FCF (€, Millions) | €995.8m | €1.25b | €1.42b | €1.54b | €1.64b | €1.73b | €1.81b | €1.88b | €1.94b | €2.00b |
| Growth Rate Estimate Source | Analyst x5 | Analyst x5 | Analyst x1 | Est @ 8.67% | Est @ 6.74% | Est @ 5.39% | Est @ 4.44% | Est @ 3.78% | Est @ 3.31% | Est @ 2.99% |
| Present Value (€, Millions) Discounted @ 7.6% | €926 | €1.1k | €1.1k | €1.2k | €1.1k | €1.1k | €1.1k | €1.0k | €1.0k | €963 |
("Est" = FCF growth rate estimated by Simply Wall St)
Present Value of 10-year Cash Flow (PVCF) = €11b
After calculating the present value of future cash flows in the initial 10-year period, we need to calculate the Terminal Value, which accounts for all future cash flows beyond the first stage. The Gordon Growth formula is used to calculate Terminal Value at a future annual growth rate equal to the 5-year average of the 10-year government bond yield of 2.2%. We discount the terminal cash flows to today's value at a cost of equity of 7.6%.
Terminal Value (TV)= FCF2035 × (1 + g) ÷ (r – g) = €2.0b× (1 + 2.2%) ÷ (7.6%– 2.2%) = €38b
Present Value of Terminal Value (PVTV)= TV / (1 + r)10= €38b÷ ( 1 + 7.6%)10= €18b
The total value is the sum of cash flows for the next ten years plus the discounted terminal value, which results in the Total Equity Value, which in this case is €29b. The last step is to then divide the equity value by the number of shares outstanding. Compared to the current share price of €46.4, the company appears around fair value at the time of writing. Remember though, that this is just an approximate valuation, and like any complex formula - garbage in, garbage out.
Important Assumptions
The calculation above is very dependent on two assumptions. The first is the discount rate and the other is the cash flows. You don't have to agree with these inputs, I recommend redoing the calculations yourself and playing with them. The DCF also does not consider the possible cyclicality of an industry, or a company's future capital requirements, so it does not give a full picture of a company's potential performance. Given that we are looking at Ferrovial as potential shareholders, the cost of equity is used as the discount rate, rather than the cost of capital (or weighted average cost of capital, WACC) which accounts for debt. In this calculation we've used 7.6%, which is based on a levered beta of 1.269. Beta is a measure of a stock's volatility, compared to the market as a whole. We get our beta from the industry average beta of globally comparable companies, with an imposed limit between 0.8 and 2.0, which is a reasonable range for a stable business.
View our latest analysis for Ferrovial
SWOT Analysis for Ferrovial
Strength
- Earnings growth over the past year exceeded the industry.
- Debt is well covered by earnings.
Weakness
- Dividend is low compared to the top 25% of dividend payers in the Construction market.
- Expensive based on P/E ratio and estimated fair value.
Opportunity
- FER's financial characteristics indicate limited near-term opportunities for shareholders.
Threat
- Debt is not well covered by operating cash flow.
- Annual earnings are forecast to decline for the next 3 years.
Moving On:
Valuation is only one side of the coin in terms of building your investment thesis, and it is only one of many factors that you need to assess for a company. The DCF model is not a perfect stock valuation tool. Rather it should be seen as a guide to "what assumptions need to be true for this stock to be under/overvalued?" For instance, if the terminal value growth rate is adjusted slightly, it can dramatically alter the overall result. For Ferrovial, we've put together three pertinent items you should look at:
- Risks: Consider for instance, the ever-present spectre of investment risk. We've identified 3 warning signs with Ferrovial (at least 2 which can't be ignored) , and understanding them should be part of your investment process.
- Future Earnings: How does FER's growth rate compare to its peers and the wider market? Dig deeper into the analyst consensus number for the upcoming years by interacting with our free analyst growth expectation chart.
- Other Solid Businesses: Low debt, high returns on equity and good past performance are fundamental to a strong business. Why not explore our interactive list of stocks with solid business fundamentals to see if there are other companies you may not have considered!
PS. Simply Wall St updates its DCF calculation for every Spanish stock every day, so if you want to find the intrinsic value of any other stock just search here.
New: AI Stock Screener & Alerts
Our new AI Stock Screener scans the market every day to uncover opportunities.
• Dividend Powerhouses (3%+ Yield)
• Undervalued Small Caps with Insider Buying
• High growth Tech and AI Companies
Or build your own from over 50 metrics.
Have feedback on this article? Concerned about the content? Get in touch with us directly. Alternatively, email editorial-team (at) simplywallst.com.
This article by Simply Wall St is general in nature. We provide commentary based on historical data and analyst forecasts only using an unbiased methodology and our articles are not intended to be financial advice. It does not constitute a recommendation to buy or sell any stock, and does not take account of your objectives, or your financial situation. We aim to bring you long-term focused analysis driven by fundamental data. Note that our analysis may not factor in the latest price-sensitive company announcements or qualitative material. Simply Wall St has no position in any stocks mentioned.
About BME:FER
Ferrovial
Engages in the design, construction, financing, operation, and maintenance of transport infrastructure and urban services internationally.
Proven track record with low risk.
Similar Companies
Market Insights

Advertisement
Community Narratives
A formidable player in AI and enterprise computing.
Fair Value US$210.00|13.6% overvalued
CO
Community Contributor
IREN's Bold Moves in Sustainable Bitcoin Mining & AI Data Centers
Fair Value US$89.00|23.6% undervalued
BL
Community Contributor
Cooling the Champions: The Aussie Tech Behind F1's Victories
Fair Value AU$12.40|37.6% undervalued
TR
Community Contributor