- China
- /
- Infrastructure
- /
- SZSE:001872
A Look At The Intrinsic Value Of China Merchants Port Group Co., Ltd. (SZSE:001872)

Key Insights
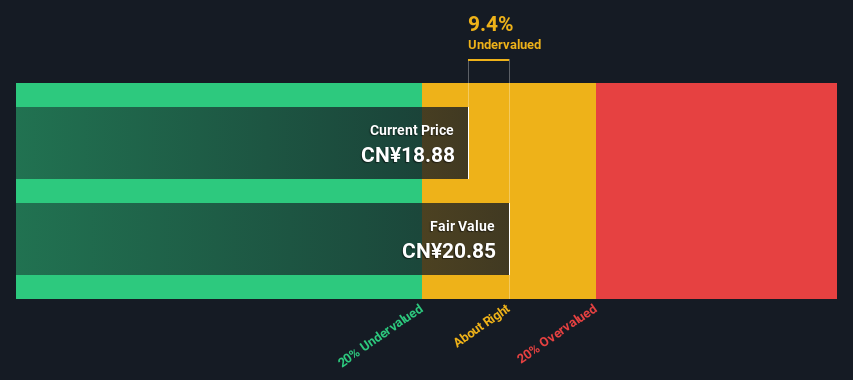
- The projected fair value for China Merchants Port Group is CN¥20.85 based on 2 Stage Free Cash Flow to Equity
- With CN¥18.88 share price, China Merchants Port Group appears to be trading close to its estimated fair value
- The average premium for China Merchants Port Group's competitorsis currently 258%
How far off is China Merchants Port Group Co., Ltd. (SZSE:001872) from its intrinsic value? Using the most recent financial data, we'll take a look at whether the stock is fairly priced by estimating the company's future cash flows and discounting them to their present value. We will use the Discounted Cash Flow (DCF) model on this occasion. Models like these may appear beyond the comprehension of a lay person, but they're fairly easy to follow.
Companies can be valued in a lot of ways, so we would point out that a DCF is not perfect for every situation. If you want to learn more about discounted cash flow, the rationale behind this calculation can be read in detail in the Simply Wall St analysis model.
View our latest analysis for China Merchants Port Group
The Method
We're using the 2-stage growth model, which simply means we take in account two stages of company's growth. In the initial period the company may have a higher growth rate and the second stage is usually assumed to have a stable growth rate. To start off with, we need to estimate the next ten years of cash flows. Seeing as no analyst estimates of free cash flow are available to us, we have extrapolate the previous free cash flow (FCF) from the company's last reported value. We assume companies with shrinking free cash flow will slow their rate of shrinkage, and that companies with growing free cash flow will see their growth rate slow, over this period. We do this to reflect that growth tends to slow more in the early years than it does in later years.
Generally we assume that a dollar today is more valuable than a dollar in the future, and so the sum of these future cash flows is then discounted to today's value:
10-year free cash flow (FCF) estimate
| 2024 | 2025 | 2026 | 2027 | 2028 | 2029 | 2030 | 2031 | 2032 | 2033 | |
| Levered FCF (CN¥, Millions) | CN¥5.62b | CN¥5.89b | CN¥6.13b | CN¥6.37b | CN¥6.59b | CN¥6.81b | CN¥7.03b | CN¥7.25b | CN¥7.47b | CN¥7.70b |
| Growth Rate Estimate Source | Est @ 5.54% | Est @ 4.75% | Est @ 4.19% | Est @ 3.81% | Est @ 3.53% | Est @ 3.34% | Est @ 3.21% | Est @ 3.12% | Est @ 3.05% | Est @ 3.01% |
| Present Value (CN¥, Millions) Discounted @ 14% | CN¥4.9k | CN¥4.5k | CN¥4.1k | CN¥3.7k | CN¥3.4k | CN¥3.1k | CN¥2.8k | CN¥2.5k | CN¥2.3k | CN¥2.0k |
("Est" = FCF growth rate estimated by Simply Wall St)
Present Value of 10-year Cash Flow (PVCF) = CN¥33b
We now need to calculate the Terminal Value, which accounts for all the future cash flows after this ten year period. The Gordon Growth formula is used to calculate Terminal Value at a future annual growth rate equal to the 5-year average of the 10-year government bond yield of 2.9%. We discount the terminal cash flows to today's value at a cost of equity of 14%.
Terminal Value (TV)= FCF2033 × (1 + g) ÷ (r – g) = CN¥7.7b× (1 + 2.9%) ÷ (14%– 2.9%) = CN¥70b
Present Value of Terminal Value (PVTV)= TV / (1 + r)10= CN¥70b÷ ( 1 + 14%)10= CN¥19b
The total value, or equity value, is then the sum of the present value of the future cash flows, which in this case is CN¥52b. The last step is to then divide the equity value by the number of shares outstanding. Compared to the current share price of CN¥18.9, the company appears about fair value at a 9.4% discount to where the stock price trades currently. Remember though, that this is just an approximate valuation, and like any complex formula - garbage in, garbage out.
Important Assumptions
We would point out that the most important inputs to a discounted cash flow are the discount rate and of course the actual cash flows. If you don't agree with these result, have a go at the calculation yourself and play with the assumptions. The DCF also does not consider the possible cyclicality of an industry, or a company's future capital requirements, so it does not give a full picture of a company's potential performance. Given that we are looking at China Merchants Port Group as potential shareholders, the cost of equity is used as the discount rate, rather than the cost of capital (or weighted average cost of capital, WACC) which accounts for debt. In this calculation we've used 14%, which is based on a levered beta of 2.000. Beta is a measure of a stock's volatility, compared to the market as a whole. We get our beta from the industry average beta of globally comparable companies, with an imposed limit between 0.8 and 2.0, which is a reasonable range for a stable business.
SWOT Analysis for China Merchants Port Group
- Earnings growth over the past year exceeded its 5-year average.
- Debt is well covered by earnings.
- Dividends are covered by earnings and cash flows.
- Dividend is in the top 25% of dividend payers in the market.
- Earnings growth over the past year underperformed the Infrastructure industry.
- Annual earnings are forecast to grow for the next 3 years.
- Good value based on P/E ratio and estimated fair value.
- Debt is not well covered by operating cash flow.
Moving On:
Although the valuation of a company is important, it ideally won't be the sole piece of analysis you scrutinize for a company. DCF models are not the be-all and end-all of investment valuation. Preferably you'd apply different cases and assumptions and see how they would impact the company's valuation. For example, changes in the company's cost of equity or the risk free rate can significantly impact the valuation. For China Merchants Port Group, there are three further elements you should further examine:
- Risks: You should be aware of the 1 warning sign for China Merchants Port Group we've uncovered before considering an investment in the company.
- Future Earnings: How does 001872's growth rate compare to its peers and the wider market? Dig deeper into the analyst consensus number for the upcoming years by interacting with our free analyst growth expectation chart.
- Other High Quality Alternatives: Do you like a good all-rounder? Explore our interactive list of high quality stocks to get an idea of what else is out there you may be missing!
PS. Simply Wall St updates its DCF calculation for every Chinese stock every day, so if you want to find the intrinsic value of any other stock just search here.
New: AI Stock Screener & Alerts
Our new AI Stock Screener scans the market every day to uncover opportunities.
• Dividend Powerhouses (3%+ Yield)
• Undervalued Small Caps with Insider Buying
• High growth Tech and AI Companies
Or build your own from over 50 metrics.
Have feedback on this article? Concerned about the content? Get in touch with us directly. Alternatively, email editorial-team (at) simplywallst.com.
This article by Simply Wall St is general in nature. We provide commentary based on historical data and analyst forecasts only using an unbiased methodology and our articles are not intended to be financial advice. It does not constitute a recommendation to buy or sell any stock, and does not take account of your objectives, or your financial situation. We aim to bring you long-term focused analysis driven by fundamental data. Note that our analysis may not factor in the latest price-sensitive company announcements or qualitative material. Simply Wall St has no position in any stocks mentioned.
About SZSE:001872
China Merchants Port Group
Provides port, bonded logistics, and other services in Mainland China, Hong Kong, Taiwan, and internationally.
Undervalued with solid track record and pays a dividend.
Similar Companies
Market Insights

Community Narratives
