
Advertisement
- China
- /
- Electronic Equipment and Components
- /
- SHSE:601231
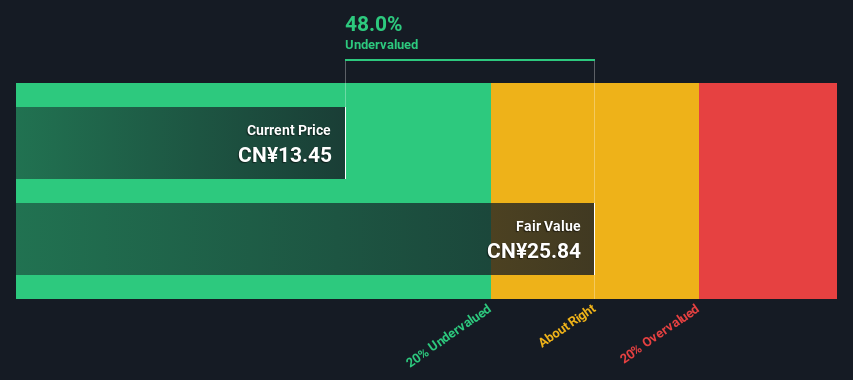
Is There An Opportunity With Universal Scientific Industrial (Shanghai) Co., Ltd.'s (SHSE:601231) 48% Undervaluation?

Key Insights
- Using the 2 Stage Free Cash Flow to Equity, Universal Scientific Industrial (Shanghai) fair value estimate is CN¥25.84
- Universal Scientific Industrial (Shanghai)'s CN¥13.45 share price signals that it might be 48% undervalued
- Analyst price target for 601231 is CN¥18.84 which is 27% below our fair value estimate
In this article we are going to estimate the intrinsic value of Universal Scientific Industrial (Shanghai) Co., Ltd. (SHSE:601231) by taking the expected future cash flows and discounting them to their present value. We will take advantage of the Discounted Cash Flow (DCF) model for this purpose. There's really not all that much to it, even though it might appear quite complex.
Companies can be valued in a lot of ways, so we would point out that a DCF is not perfect for every situation. If you want to learn more about discounted cash flow, the rationale behind this calculation can be read in detail in the Simply Wall St analysis model.
View our latest analysis for Universal Scientific Industrial (Shanghai)
Is Universal Scientific Industrial (Shanghai) Fairly Valued?
We are going to use a two-stage DCF model, which, as the name states, takes into account two stages of growth. The first stage is generally a higher growth period which levels off heading towards the terminal value, captured in the second 'steady growth' period. To start off with, we need to estimate the next ten years of cash flows. Where possible we use analyst estimates, but when these aren't available we extrapolate the previous free cash flow (FCF) from the last estimate or reported value. We assume companies with shrinking free cash flow will slow their rate of shrinkage, and that companies with growing free cash flow will see their growth rate slow, over this period. We do this to reflect that growth tends to slow more in the early years than it does in later years.
A DCF is all about the idea that a dollar in the future is less valuable than a dollar today, so we discount the value of these future cash flows to their estimated value in today's dollars:
10-year free cash flow (FCF) forecast
| 2025 | 2026 | 2027 | 2028 | 2029 | 2030 | 2031 | 2032 | 2033 | 2034 | |
| Levered FCF (CN¥, Millions) | CN¥2.40b | CN¥3.14b | CN¥3.37b | CN¥3.58b | CN¥3.76b | CN¥3.93b | CN¥4.08b | CN¥4.23b | CN¥4.37b | CN¥4.51b |
| Growth Rate Estimate Source | Analyst x3 | Analyst x3 | Est @ 7.42% | Est @ 6.05% | Est @ 5.09% | Est @ 4.42% | Est @ 3.95% | Est @ 3.62% | Est @ 3.39% | Est @ 3.23% |
| Present Value (CN¥, Millions) Discounted @ 8.8% | CN¥2.2k | CN¥2.7k | CN¥2.6k | CN¥2.5k | CN¥2.5k | CN¥2.4k | CN¥2.3k | CN¥2.1k | CN¥2.0k | CN¥1.9k |
("Est" = FCF growth rate estimated by Simply Wall St)
Present Value of 10-year Cash Flow (PVCF) = CN¥23b
After calculating the present value of future cash flows in the initial 10-year period, we need to calculate the Terminal Value, which accounts for all future cash flows beyond the first stage. The Gordon Growth formula is used to calculate Terminal Value at a future annual growth rate equal to the 5-year average of the 10-year government bond yield of 2.9%. We discount the terminal cash flows to today's value at a cost of equity of 8.8%.
Terminal Value (TV)= FCF2034 × (1 + g) ÷ (r – g) = CN¥4.5b× (1 + 2.9%) ÷ (8.8%– 2.9%) = CN¥77b
Present Value of Terminal Value (PVTV)= TV / (1 + r)10= CN¥77b÷ ( 1 + 8.8%)10= CN¥33b
The total value is the sum of cash flows for the next ten years plus the discounted terminal value, which results in the Total Equity Value, which in this case is CN¥56b. To get the intrinsic value per share, we divide this by the total number of shares outstanding. Compared to the current share price of CN¥13.5, the company appears quite undervalued at a 48% discount to where the stock price trades currently. Remember though, that this is just an approximate valuation, and like any complex formula - garbage in, garbage out.
The Assumptions
Now the most important inputs to a discounted cash flow are the discount rate, and of course, the actual cash flows. If you don't agree with these result, have a go at the calculation yourself and play with the assumptions. The DCF also does not consider the possible cyclicality of an industry, or a company's future capital requirements, so it does not give a full picture of a company's potential performance. Given that we are looking at Universal Scientific Industrial (Shanghai) as potential shareholders, the cost of equity is used as the discount rate, rather than the cost of capital (or weighted average cost of capital, WACC) which accounts for debt. In this calculation we've used 8.8%, which is based on a levered beta of 1.204. Beta is a measure of a stock's volatility, compared to the market as a whole. We get our beta from the industry average beta of globally comparable companies, with an imposed limit between 0.8 and 2.0, which is a reasonable range for a stable business.
SWOT Analysis for Universal Scientific Industrial (Shanghai)
Strength
- Debt is not viewed as a risk.
- Dividends are covered by earnings and cash flows.
Weakness
- Earnings declined over the past year.
- Dividend is low compared to the top 25% of dividend payers in the Electronic market.
Opportunity
- Annual earnings are forecast to grow for the next 3 years.
- Good value based on P/E ratio and estimated fair value.
Threat
- Annual earnings are forecast to grow slower than the Chinese market.
Looking Ahead:
Whilst important, the DCF calculation ideally won't be the sole piece of analysis you scrutinize for a company. It's not possible to obtain a foolproof valuation with a DCF model. Instead the best use for a DCF model is to test certain assumptions and theories to see if they would lead to the company being undervalued or overvalued. If a company grows at a different rate, or if its cost of equity or risk free rate changes sharply, the output can look very different. Can we work out why the company is trading at a discount to intrinsic value? For Universal Scientific Industrial (Shanghai), there are three additional items you should explore:
- Risks: For example, we've discovered 1 warning sign for Universal Scientific Industrial (Shanghai) that you should be aware of before investing here.
- Future Earnings: How does 601231's growth rate compare to its peers and the wider market? Dig deeper into the analyst consensus number for the upcoming years by interacting with our free analyst growth expectation chart.
- Other High Quality Alternatives: Do you like a good all-rounder? Explore our interactive list of high quality stocks to get an idea of what else is out there you may be missing!
PS. Simply Wall St updates its DCF calculation for every Chinese stock every day, so if you want to find the intrinsic value of any other stock just search here.
New: AI Stock Screener & Alerts
Our new AI Stock Screener scans the market every day to uncover opportunities.
• Dividend Powerhouses (3%+ Yield)
• Undervalued Small Caps with Insider Buying
• High growth Tech and AI Companies
Or build your own from over 50 metrics.
Have feedback on this article? Concerned about the content? Get in touch with us directly. Alternatively, email editorial-team (at) simplywallst.com.
This article by Simply Wall St is general in nature. We provide commentary based on historical data and analyst forecasts only using an unbiased methodology and our articles are not intended to be financial advice. It does not constitute a recommendation to buy or sell any stock, and does not take account of your objectives, or your financial situation. We aim to bring you long-term focused analysis driven by fundamental data. Note that our analysis may not factor in the latest price-sensitive company announcements or qualitative material. Simply Wall St has no position in any stocks mentioned.
About SHSE:601231
Universal Scientific Industrial (Shanghai)
An electronic design and manufacturing service company, engages in the design, miniaturization, manufacture, industrial software and hardware solutions, material procurement, logistics, and maintenance services of electronic products worldwide.
Undervalued with excellent balance sheet and pays a dividend.
Similar Companies
Market Insights

Advertisement
Community Narratives
MicroStrategy: Volatile Gamble or Golden Opportunity?
Fair Value US$663.00|36.2% undervalued
BL
Community Contributor
Emerging Markets and Debt Reduction Will Propel Bath & Body Works Forward
Fair Value US$40.73|22.0% undervalued
ZW
Community Contributor
An amazing opportunity to potentially get a 100 bagger
Fair Value US$10.00|46.4% overvalued
DA
Community Contributor