Estimating The Intrinsic Value Of Shandong Jincheng Pharmaceutical Group Co., Ltd (SZSE:300233)


Key Insights
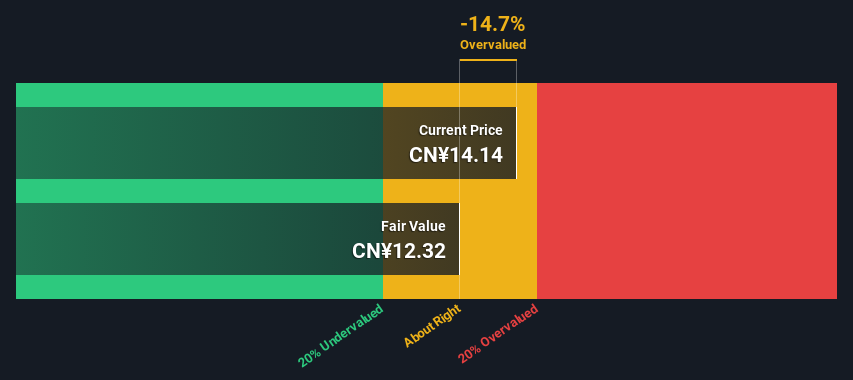
- Using the 2 Stage Free Cash Flow to Equity, Shandong Jincheng Pharmaceutical Group fair value estimate is CN¥12.32
- With CN¥14.14 share price, Shandong Jincheng Pharmaceutical Group appears to be trading close to its estimated fair value
- Shandong Jincheng Pharmaceutical Group's peers seem to be trading at a higher premium to fair value based onthe industry average of -218%
Today we will run through one way of estimating the intrinsic value of Shandong Jincheng Pharmaceutical Group Co., Ltd (SZSE:300233) by projecting its future cash flows and then discounting them to today's value. The Discounted Cash Flow (DCF) model is the tool we will apply to do this. Believe it or not, it's not too difficult to follow, as you'll see from our example!
Remember though, that there are many ways to estimate a company's value, and a DCF is just one method. For those who are keen learners of equity analysis, the Simply Wall St analysis model here may be something of interest to you.
See our latest analysis for Shandong Jincheng Pharmaceutical Group
The Method
We use what is known as a 2-stage model, which simply means we have two different periods of growth rates for the company's cash flows. Generally the first stage is higher growth, and the second stage is a lower growth phase. To start off with, we need to estimate the next ten years of cash flows. Seeing as no analyst estimates of free cash flow are available to us, we have extrapolate the previous free cash flow (FCF) from the company's last reported value. We assume companies with shrinking free cash flow will slow their rate of shrinkage, and that companies with growing free cash flow will see their growth rate slow, over this period. We do this to reflect that growth tends to slow more in the early years than it does in later years.
Generally we assume that a dollar today is more valuable than a dollar in the future, and so the sum of these future cash flows is then discounted to today's value:
10-year free cash flow (FCF) estimate
| 2025 | 2026 | 2027 | 2028 | 2029 | 2030 | 2031 | 2032 | 2033 | 2034 | |
| Levered FCF (CN¥, Millions) | CN¥212.5m | CN¥208.6m | CN¥207.7m | CN¥208.9m | CN¥211.4m | CN¥215.1m | CN¥219.5m | CN¥224.6m | CN¥230.1m | CN¥236.0m |
| Growth Rate Estimate Source | Est @ -3.85% | Est @ -1.84% | Est @ -0.43% | Est @ 0.55% | Est @ 1.24% | Est @ 1.72% | Est @ 2.06% | Est @ 2.30% | Est @ 2.46% | Est @ 2.58% |
| Present Value (CN¥, Millions) Discounted @ 6.8% | CN¥199 | CN¥183 | CN¥170 | CN¥160 | CN¥152 | CN¥145 | CN¥138 | CN¥132 | CN¥127 | CN¥122 |
("Est" = FCF growth rate estimated by Simply Wall St)
Present Value of 10-year Cash Flow (PVCF) = CN¥1.5b
We now need to calculate the Terminal Value, which accounts for all the future cash flows after this ten year period. For a number of reasons a very conservative growth rate is used that cannot exceed that of a country's GDP growth. In this case we have used the 5-year average of the 10-year government bond yield (2.9%) to estimate future growth. In the same way as with the 10-year 'growth' period, we discount future cash flows to today's value, using a cost of equity of 6.8%.
Terminal Value (TV)= FCF2034 × (1 + g) ÷ (r – g) = CN¥236m× (1 + 2.9%) ÷ (6.8%– 2.9%) = CN¥6.1b
Present Value of Terminal Value (PVTV)= TV / (1 + r)10= CN¥6.1b÷ ( 1 + 6.8%)10= CN¥3.1b
The total value is the sum of cash flows for the next ten years plus the discounted terminal value, which results in the Total Equity Value, which in this case is CN¥4.7b. To get the intrinsic value per share, we divide this by the total number of shares outstanding. Relative to the current share price of CN¥14.1, the company appears around fair value at the time of writing. Remember though, that this is just an approximate valuation, and like any complex formula - garbage in, garbage out.
Important Assumptions
The calculation above is very dependent on two assumptions. The first is the discount rate and the other is the cash flows. You don't have to agree with these inputs, I recommend redoing the calculations yourself and playing with them. The DCF also does not consider the possible cyclicality of an industry, or a company's future capital requirements, so it does not give a full picture of a company's potential performance. Given that we are looking at Shandong Jincheng Pharmaceutical Group as potential shareholders, the cost of equity is used as the discount rate, rather than the cost of capital (or weighted average cost of capital, WACC) which accounts for debt. In this calculation we've used 6.8%, which is based on a levered beta of 0.800. Beta is a measure of a stock's volatility, compared to the market as a whole. We get our beta from the industry average beta of globally comparable companies, with an imposed limit between 0.8 and 2.0, which is a reasonable range for a stable business.
Moving On:
Although the valuation of a company is important, it shouldn't be the only metric you look at when researching a company. DCF models are not the be-all and end-all of investment valuation. Preferably you'd apply different cases and assumptions and see how they would impact the company's valuation. If a company grows at a different rate, or if its cost of equity or risk free rate changes sharply, the output can look very different. For Shandong Jincheng Pharmaceutical Group, we've put together three fundamental elements you should further examine:
- Risks: Consider for instance, the ever-present spectre of investment risk. We've identified 2 warning signs with Shandong Jincheng Pharmaceutical Group , and understanding them should be part of your investment process.
- Other Solid Businesses: Low debt, high returns on equity and good past performance are fundamental to a strong business. Why not explore our interactive list of stocks with solid business fundamentals to see if there are other companies you may not have considered!
- Other Top Analyst Picks: Interested to see what the analysts are thinking? Take a look at our interactive list of analysts' top stock picks to find out what they feel might have an attractive future outlook!
PS. The Simply Wall St app conducts a discounted cash flow valuation for every stock on the SZSE every day. If you want to find the calculation for other stocks just search here.
New: Manage All Your Stock Portfolios in One Place
We've created the ultimate portfolio companion for stock investors, and it's free.
• Connect an unlimited number of Portfolios and see your total in one currency
• Be alerted to new Warning Signs or Risks via email or mobile
• Track the Fair Value of your stocks
Have feedback on this article? Concerned about the content? Get in touch with us directly. Alternatively, email editorial-team (at) simplywallst.com.
This article by Simply Wall St is general in nature. We provide commentary based on historical data and analyst forecasts only using an unbiased methodology and our articles are not intended to be financial advice. It does not constitute a recommendation to buy or sell any stock, and does not take account of your objectives, or your financial situation. We aim to bring you long-term focused analysis driven by fundamental data. Note that our analysis may not factor in the latest price-sensitive company announcements or qualitative material. Simply Wall St has no position in any stocks mentioned.
About SZSE:300233
Shandong Jincheng Pharmaceutical Group
Researches and develops, produces, markets, and sells Cephalosporin intermediates in China and internationally.
Solid track record with excellent balance sheet and pays a dividend.
