- China
- /
- Metals and Mining
- /
- SHSE:600549
Xiamen Tungsten Co.,Ltd.'s (SHSE:600549) Intrinsic Value Is Potentially 90% Above Its Share Price


Key Insights
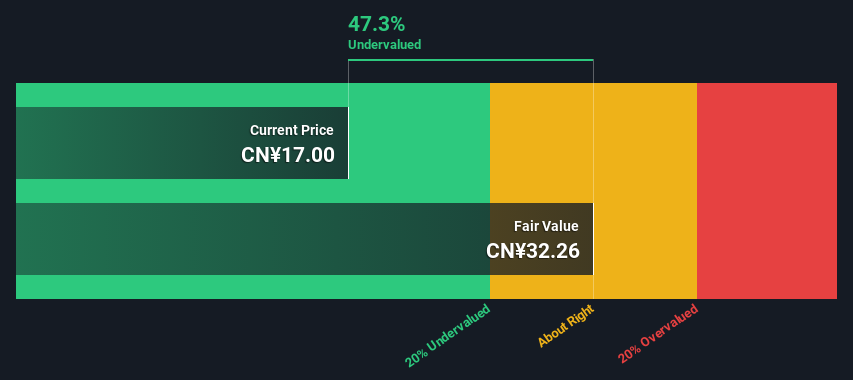
- The projected fair value for Xiamen TungstenLtd is CN¥32.26 based on 2 Stage Free Cash Flow to Equity
- Current share price of CN¥17.00 suggests Xiamen TungstenLtd is potentially 47% undervalued
- The average premium for Xiamen TungstenLtd's competitorsis currently 1,814%
Today we will run through one way of estimating the intrinsic value of Xiamen Tungsten Co.,Ltd. (SHSE:600549) by taking the expected future cash flows and discounting them to today's value. This will be done using the Discounted Cash Flow (DCF) model. Believe it or not, it's not too difficult to follow, as you'll see from our example!
Companies can be valued in a lot of ways, so we would point out that a DCF is not perfect for every situation. Anyone interested in learning a bit more about intrinsic value should have a read of the Simply Wall St analysis model.
View our latest analysis for Xiamen TungstenLtd
Is Xiamen TungstenLtd Fairly Valued?
We're using the 2-stage growth model, which simply means we take in account two stages of company's growth. In the initial period the company may have a higher growth rate and the second stage is usually assumed to have a stable growth rate. To start off with, we need to estimate the next ten years of cash flows. Seeing as no analyst estimates of free cash flow are available to us, we have extrapolate the previous free cash flow (FCF) from the company's last reported value. We assume companies with shrinking free cash flow will slow their rate of shrinkage, and that companies with growing free cash flow will see their growth rate slow, over this period. We do this to reflect that growth tends to slow more in the early years than it does in later years.
A DCF is all about the idea that a dollar in the future is less valuable than a dollar today, so we need to discount the sum of these future cash flows to arrive at a present value estimate:
10-year free cash flow (FCF) estimate
| 2025 | 2026 | 2027 | 2028 | 2029 | 2030 | 2031 | 2032 | 2033 | 2034 | |
| Levered FCF (CN¥, Millions) | CN¥3.30b | CN¥3.50b | CN¥3.68b | CN¥3.85b | CN¥4.00b | CN¥4.15b | CN¥4.29b | CN¥4.43b | CN¥4.57b | CN¥4.71b |
| Growth Rate Estimate Source | Est @ 7.45% | Est @ 6.08% | Est @ 5.13% | Est @ 4.46% | Est @ 3.99% | Est @ 3.66% | Est @ 3.44% | Est @ 3.27% | Est @ 3.16% | Est @ 3.08% |
| Present Value (CN¥, Millions) Discounted @ 11% | CN¥3.0k | CN¥2.9k | CN¥2.7k | CN¥2.6k | CN¥2.4k | CN¥2.3k | CN¥2.1k | CN¥2.0k | CN¥1.8k | CN¥1.7k |
("Est" = FCF growth rate estimated by Simply Wall St)
Present Value of 10-year Cash Flow (PVCF) = CN¥23b
The second stage is also known as Terminal Value, this is the business's cash flow after the first stage. The Gordon Growth formula is used to calculate Terminal Value at a future annual growth rate equal to the 5-year average of the 10-year government bond yield of 2.9%. We discount the terminal cash flows to today's value at a cost of equity of 11%.
Terminal Value (TV)= FCF2034 × (1 + g) ÷ (r – g) = CN¥4.7b× (1 + 2.9%) ÷ (11%– 2.9%) = CN¥62b
Present Value of Terminal Value (PVTV)= TV / (1 + r)10= CN¥62b÷ ( 1 + 11%)10= CN¥22b
The total value, or equity value, is then the sum of the present value of the future cash flows, which in this case is CN¥46b. The last step is to then divide the equity value by the number of shares outstanding. Relative to the current share price of CN¥17.0, the company appears quite good value at a 47% discount to where the stock price trades currently. The assumptions in any calculation have a big impact on the valuation, so it is better to view this as a rough estimate, not precise down to the last cent.
The Assumptions
The calculation above is very dependent on two assumptions. The first is the discount rate and the other is the cash flows. If you don't agree with these result, have a go at the calculation yourself and play with the assumptions. The DCF also does not consider the possible cyclicality of an industry, or a company's future capital requirements, so it does not give a full picture of a company's potential performance. Given that we are looking at Xiamen TungstenLtd as potential shareholders, the cost of equity is used as the discount rate, rather than the cost of capital (or weighted average cost of capital, WACC) which accounts for debt. In this calculation we've used 11%, which is based on a levered beta of 1.389. Beta is a measure of a stock's volatility, compared to the market as a whole. We get our beta from the industry average beta of globally comparable companies, with an imposed limit between 0.8 and 2.0, which is a reasonable range for a stable business.
SWOT Analysis for Xiamen TungstenLtd
- Earnings growth over the past year exceeded the industry.
- Debt is well covered by earnings and cashflows.
- Dividends are covered by earnings and cash flows.
- Dividend is low compared to the top 25% of dividend payers in the Metals and Mining market.
- Annual earnings are forecast to grow for the next 3 years.
- Good value based on P/E ratio and estimated fair value.
- No apparent threats visible for 600549.
Moving On:
Valuation is only one side of the coin in terms of building your investment thesis, and it shouldn't be the only metric you look at when researching a company. DCF models are not the be-all and end-all of investment valuation. Instead the best use for a DCF model is to test certain assumptions and theories to see if they would lead to the company being undervalued or overvalued. For instance, if the terminal value growth rate is adjusted slightly, it can dramatically alter the overall result. What is the reason for the share price sitting below the intrinsic value? For Xiamen TungstenLtd, we've put together three important factors you should look at:
- Risks: To that end, you should be aware of the 2 warning signs we've spotted with Xiamen TungstenLtd .
- Future Earnings: How does 600549's growth rate compare to its peers and the wider market? Dig deeper into the analyst consensus number for the upcoming years by interacting with our free analyst growth expectation chart.
- Other Solid Businesses: Low debt, high returns on equity and good past performance are fundamental to a strong business. Why not explore our interactive list of stocks with solid business fundamentals to see if there are other companies you may not have considered!
PS. The Simply Wall St app conducts a discounted cash flow valuation for every stock on the SHSE every day. If you want to find the calculation for other stocks just search here.
If you're looking to trade Xiamen TungstenLtd, open an account with the lowest-cost platform trusted by professionals, Interactive Brokers.
With clients in over 200 countries and territories, and access to 160 markets, IBKR lets you trade stocks, options, futures, forex, bonds and funds from a single integrated account.
Enjoy no hidden fees, no account minimums, and FX conversion rates as low as 0.03%, far better than what most brokers offer.
Sponsored ContentNew: AI Stock Screener & Alerts
Our new AI Stock Screener scans the market every day to uncover opportunities.
• Dividend Powerhouses (3%+ Yield)
• Undervalued Small Caps with Insider Buying
• High growth Tech and AI Companies
Or build your own from over 50 metrics.
Have feedback on this article? Concerned about the content? Get in touch with us directly. Alternatively, email editorial-team (at) simplywallst.com.
This article by Simply Wall St is general in nature. We provide commentary based on historical data and analyst forecasts only using an unbiased methodology and our articles are not intended to be financial advice. It does not constitute a recommendation to buy or sell any stock, and does not take account of your objectives, or your financial situation. We aim to bring you long-term focused analysis driven by fundamental data. Note that our analysis may not factor in the latest price-sensitive company announcements or qualitative material. Simply Wall St has no position in any stocks mentioned.
Have feedback on this article? Concerned about the content? Get in touch with us directly. Alternatively, email editorial-team@simplywallst.com
About SHSE:600549
Xiamen TungstenLtd
Engages in the sale of tungsten, molybdenum, rare earth, and new energy materials in China.
Flawless balance sheet established dividend payer.
Market Insights

Community Narratives
