
Advertisement
- Switzerland
- /
- Food
- /
- SWX:BARN
Barry Callebaut (VTX:BARN) shareholders have endured a 62% loss from investing in the stock three years ago

If you are building a properly diversified stock portfolio, the chances are some of your picks will perform badly. But long term Barry Callebaut AG (VTX:BARN) shareholders have had a particularly rough ride in the last three year. Regrettably, they have had to cope with a 64% drop in the share price over that period. And the ride hasn't got any smoother in recent times over the last year, with the price 52% lower in that time. Shareholders have had an even rougher run lately, with the share price down 28% in the last 90 days.
Since shareholders are down over the longer term, lets look at the underlying fundamentals over the that time and see if they've been consistent with returns.
While the efficient markets hypothesis continues to be taught by some, it has been proven that markets are over-reactive dynamic systems, and investors are not always rational. By comparing earnings per share (EPS) and share price changes over time, we can get a feel for how investor attitudes to a company have morphed over time.
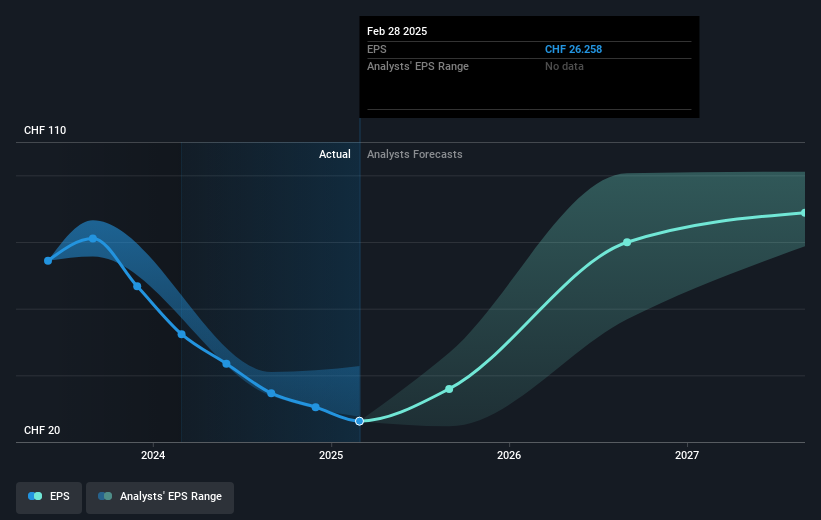
Barry Callebaut saw its EPS decline at a compound rate of 29% per year, over the last three years. So do you think it's a coincidence that the share price has dropped 29% per year, a very similar rate to the EPS? We don't. So it seems like sentiment towards the stock hasn't changed all that much over time. In this case, it seems that the EPS is guiding the share price.
The company's earnings per share (over time) is depicted in the image below (click to see the exact numbers).
Before buying or selling a stock, we always recommend a close examination of historic growth trends, available here.
What About Dividends?
When looking at investment returns, it is important to consider the difference between total shareholder return (TSR) and share price return. The TSR is a return calculation that accounts for the value of cash dividends (assuming that any dividend received was reinvested) and the calculated value of any discounted capital raisings and spin-offs. It's fair to say that the TSR gives a more complete picture for stocks that pay a dividend. As it happens, Barry Callebaut's TSR for the last 3 years was -62%, which exceeds the share price return mentioned earlier. And there's no prize for guessing that the dividend payments largely explain the divergence!
A Different Perspective
Investors in Barry Callebaut had a tough year, with a total loss of 51% (including dividends), against a market gain of about 5.1%. Even the share prices of good stocks drop sometimes, but we want to see improvements in the fundamental metrics of a business, before getting too interested. Regrettably, last year's performance caps off a bad run, with the shareholders facing a total loss of 9% per year over five years. Generally speaking long term share price weakness can be a bad sign, though contrarian investors might want to research the stock in hope of a turnaround. It's always interesting to track share price performance over the longer term. But to understand Barry Callebaut better, we need to consider many other factors. For instance, we've identified 5 warning signs for Barry Callebaut (3 make us uncomfortable) that you should be aware of.
If you are like me, then you will not want to miss this free list of undervalued small caps that insiders are buying.
Please note, the market returns quoted in this article reflect the market weighted average returns of stocks that currently trade on Swiss exchanges.
Valuation is complex, but we're here to simplify it.
Discover if Barry Callebaut might be undervalued or overvalued with our detailed analysis, featuring fair value estimates, potential risks, dividends, insider trades, and its financial condition.
Access Free AnalysisHave feedback on this article? Concerned about the content? Get in touch with us directly. Alternatively, email editorial-team (at) simplywallst.com.
This article by Simply Wall St is general in nature. We provide commentary based on historical data and analyst forecasts only using an unbiased methodology and our articles are not intended to be financial advice. It does not constitute a recommendation to buy or sell any stock, and does not take account of your objectives, or your financial situation. We aim to bring you long-term focused analysis driven by fundamental data. Note that our analysis may not factor in the latest price-sensitive company announcements or qualitative material. Simply Wall St has no position in any stocks mentioned.
About SWX:BARN
Barry Callebaut
Engages in the manufacture and sale of chocolate and cocoa products.
Moderate with moderate growth potential.
Similar Companies
Market Insights

Advertisement
Community Narratives
Pinterest will surge as advertising innovations ignite revenue growth
Fair Value US$42.63|26.3% undervalued
BR
Community Contributor
Brambles' Revenue Set to Climb 14% with Profit Margins Following
Fair Value AU$21.90|4.9% overvalued
RO
Community Contributor
Challenging Future for STG as Organic Sales Decline by 8.8%
Fair Value DKK 116.13|26.8% undervalued
KA
Community Contributor