- Switzerland
- /
- Machinery
- /
- SWX:SFSN
SFS Group's (VTX:SFSN) five-year earnings growth trails the favorable shareholder returns


When we invest, we're generally looking for stocks that outperform the market average. Buying under-rated businesses is one path to excess returns. To wit, the SFS Group share price has climbed 41% in five years, easily topping the market return of 19% (ignoring dividends). On the other hand, the more recent gains haven't been so impressive, with shareholders gaining just 4.6%, including dividends.
Since the stock has added CHF187m to its market cap in the past week alone, let's see if underlying performance has been driving long-term returns.
We check all companies for important risks. See what we found for SFS Group in our free report.To paraphrase Benjamin Graham: Over the short term the market is a voting machine, but over the long term it's a weighing machine. One way to examine how market sentiment has changed over time is to look at the interaction between a company's share price and its earnings per share (EPS).
Over half a decade, SFS Group managed to grow its earnings per share at 2.5% a year. This EPS growth is slower than the share price growth of 7% per year, over the same period. This suggests that market participants hold the company in higher regard, these days. And that's hardly shocking given the track record of growth.
The company's earnings per share (over time) is depicted in the image below (click to see the exact numbers).
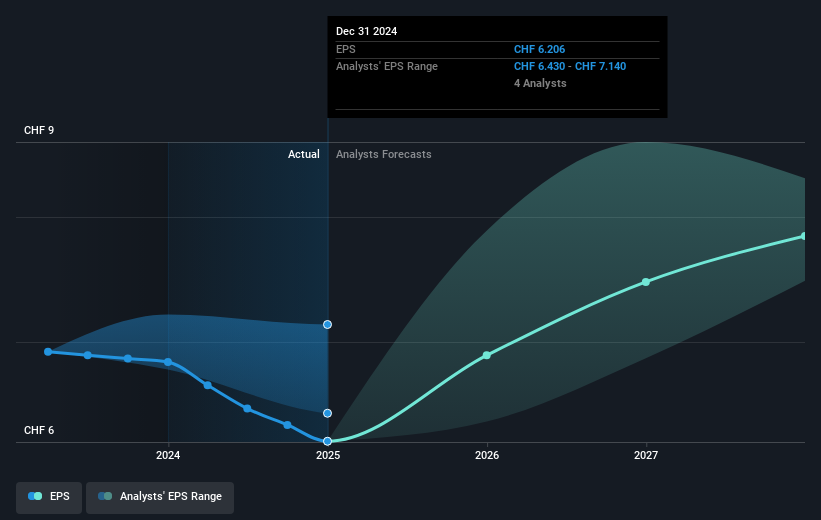
It might be well worthwhile taking a look at our free report on SFS Group's earnings, revenue and cash flow.
What About Dividends?
As well as measuring the share price return, investors should also consider the total shareholder return (TSR). The TSR incorporates the value of any spin-offs or discounted capital raisings, along with any dividends, based on the assumption that the dividends are reinvested. Arguably, the TSR gives a more comprehensive picture of the return generated by a stock. As it happens, SFS Group's TSR for the last 5 years was 56%, which exceeds the share price return mentioned earlier. This is largely a result of its dividend payments!
A Different Perspective
SFS Group provided a TSR of 4.6% over the last twelve months. Unfortunately this falls short of the market return. If we look back over five years, the returns are even better, coming in at 9% per year for five years. It's quite possible the business continues to execute with prowess, even as the share price gains are slowing. Is SFS Group cheap compared to other companies? These 3 valuation measures might help you decide.
We will like SFS Group better if we see some big insider buys. While we wait, check out this free list of undervalued stocks (mostly small caps) with considerable, recent, insider buying.
Please note, the market returns quoted in this article reflect the market weighted average returns of stocks that currently trade on Swiss exchanges.
If you're looking to trade SFS Group, open an account with the lowest-cost platform trusted by professionals, Interactive Brokers.
With clients in over 200 countries and territories, and access to 160 markets, IBKR lets you trade stocks, options, futures, forex, bonds and funds from a single integrated account.
Enjoy no hidden fees, no account minimums, and FX conversion rates as low as 0.03%, far better than what most brokers offer.
Sponsored ContentNew: Manage All Your Stock Portfolios in One Place
We've created the ultimate portfolio companion for stock investors, and it's free.
• Connect an unlimited number of Portfolios and see your total in one currency
• Be alerted to new Warning Signs or Risks via email or mobile
• Track the Fair Value of your stocks
Have feedback on this article? Concerned about the content? Get in touch with us directly. Alternatively, email editorial-team (at) simplywallst.com.
This article by Simply Wall St is general in nature. We provide commentary based on historical data and analyst forecasts only using an unbiased methodology and our articles are not intended to be financial advice. It does not constitute a recommendation to buy or sell any stock, and does not take account of your objectives, or your financial situation. We aim to bring you long-term focused analysis driven by fundamental data. Note that our analysis may not factor in the latest price-sensitive company announcements or qualitative material. Simply Wall St has no position in any stocks mentioned.
About SWX:SFSN
SFS Group
Supplies precision components and assemblies, mechanical fastening systems, tools, and procurement solutions in Switzerland and internationally.
Undervalued with excellent balance sheet and pays a dividend.
Similar Companies
Market Insights

Community Narratives


