Advertisement
Is It Time To Reassess Constellation Software (TSX:CSU) After A 49% Share Price Slide?

Reviewed by Bailey Pemberton
Before looking at models and ratios, the key question is whether Constellation Software's current share price still reflects its quality or if recent weakness has created a potential opportunity for you.
Over the last year, the stock has fallen 49.5%, with a 29.1% decline year to date, including 15.0% over the past month and 6.0% over the last week. This may signal shifting expectations and a different balance between risk and potential reward than many investors were pricing in previously.
Recent news coverage has focused on Constellation Software's role as a major acquirer in the software sector and its continued emphasis on capital allocation and portfolio management. This gives context to why investors pay close attention to changes in sentiment. Headlines around acquisition activity, integration execution and how management prioritizes cash use often sit in the background of price moves like those seen in recent months.
On Simply Wall St's valuation checks, Constellation Software currently records a 3 out of 6 value score. The next step is to unpack what different valuation approaches say about that score and then look at an even more helpful way to interpret valuation at the end of this article.
Find out why Constellation Software's -49.5% return over the last year is lagging behind its peers.
Approach 1: Constellation Software Discounted Cash Flow (DCF) Analysis
A Discounted Cash Flow, or DCF, model estimates what a company could be worth today by projecting future cash flows and discounting them back to the present using a required rate of return.
For Constellation Software, the model uses a 2 Stage Free Cash Flow to Equity approach based on cash flow projections. The latest twelve month Free Cash Flow (FCF) is $2.66b. Analysts provide explicit forecasts out to 2027, with FCF for that year projected at $3.57b. Simply Wall St then extrapolates cash flows further out to 2035 using its own growth assumptions.
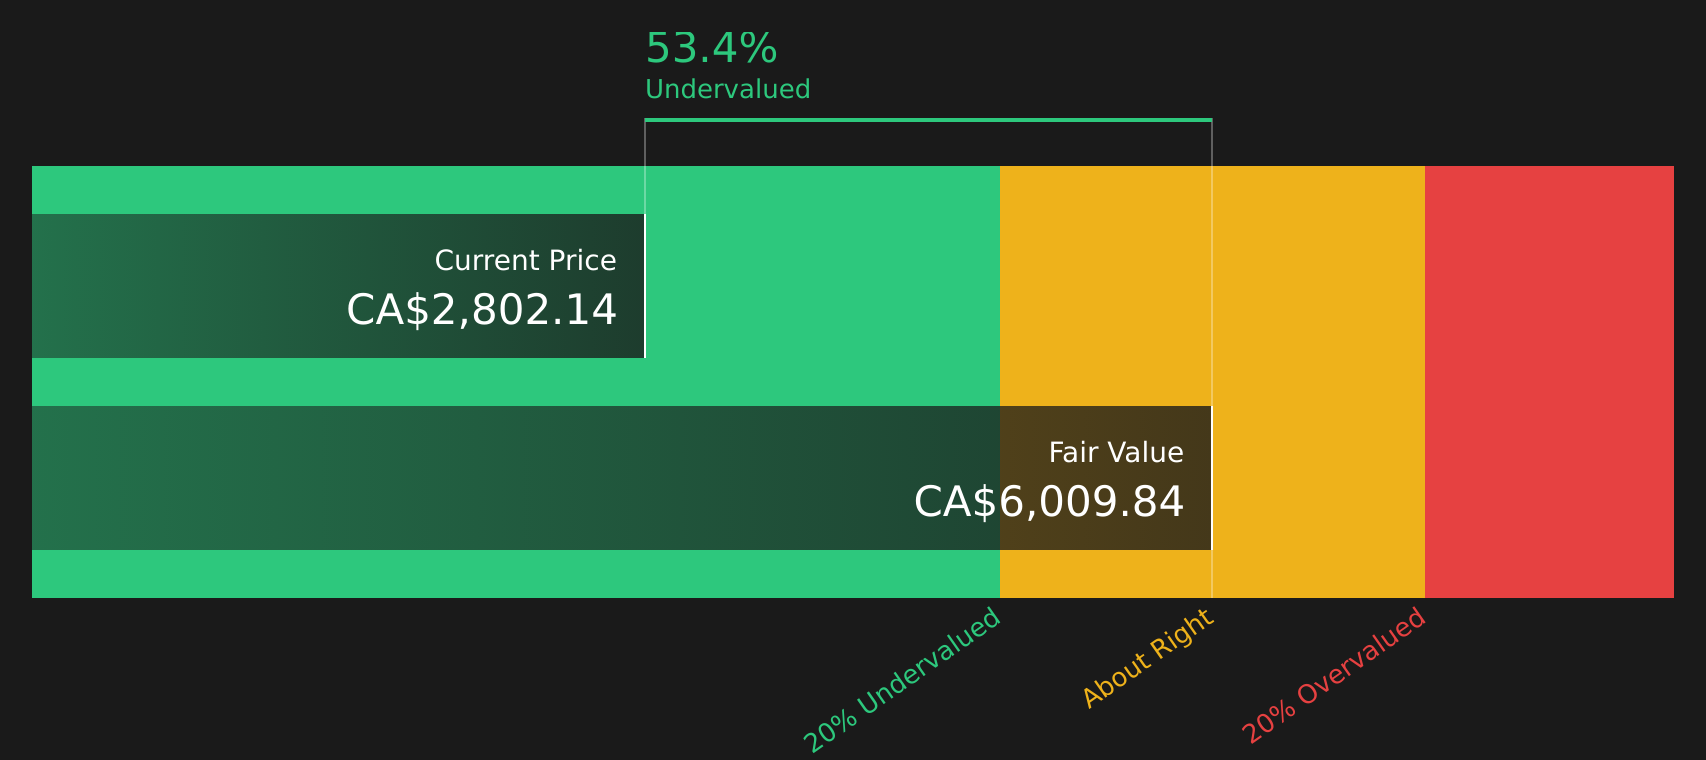
Over the next decade, the model includes a series of annual FCF projections in the billions of dollars, each discounted back to today. Adding these discounted cash flows together and including a terminal value results in an estimated intrinsic value of $5,374.87 per share.
Against the current share price, this implies a 57.3% discount, which points to Constellation Software trading well below this DCF estimate of fair value.
Result: UNDERVALUED
Our Discounted Cash Flow (DCF) analysis suggests Constellation Software is undervalued by 57.3%. Track this in your watchlist or portfolio, or discover 7 more high quality undervalued stocks.
Approach 2: Constellation Software Price vs Earnings
For profitable companies, the P/E ratio is a useful way to relate what you pay for each share to the earnings that support that price. It gives you a quick sense of how much the market is paying for each dollar of profit.
What counts as a "normal" P/E depends on how the market views a company’s growth prospects and risk. Higher expected growth or lower perceived risk can justify a higher multiple, while slower growth or higher risk tends to point to a lower one.
Constellation Software currently trades on a P/E of 68.70x. That is above both the Software industry average of 23.01x and the peer average of 54.37x. Simply Wall St’s Fair Ratio for Constellation Software is 34.94x, which is its proprietary estimate of what the P/E might be given factors such as earnings growth, industry, profit margin, market cap and risk profile.
This Fair Ratio can be more helpful than a simple peer or industry comparison because it adjusts for company specific characteristics instead of assuming that all software stocks deserve similar multiples.
Comparing the current 68.70x P/E with the 34.94x Fair Ratio points to Constellation Software trading above this Fair Ratio estimate.
Result: OVERVALUED

P/E ratios tell one story, but what if the real opportunity lies elsewhere? Start investing in legacies, not executives. Discover our 2 top founder-led companies.
Upgrade Your Decision Making: Choose your Constellation Software Narrative
Earlier it was mentioned that there is an even better way to understand valuation. Narratives are introduced here as your way to attach a clear story about Constellation Software to specific assumptions on future revenue, earnings and margins, link that story to a forecast and Fair Value, and then compare that Fair Value with the current price inside Simply Wall St's Community page. Narratives are updated when new news or earnings arrive. One investor might build a bullish CSU view around a Fair Value near CA$5,325.57 and another might anchor a more cautious view near CA$3,477.92, and both sets of numbers sit side by side so you can quickly see which story, and which Fair Value versus Price relationship, feels closer to your own view before deciding what action, if any, makes sense for you.
Do you think there's more to the story for Constellation Software? Head over to our Community to see what others are saying!

This article by Simply Wall St is general in nature. We provide commentary based on historical data and analyst forecasts only using an unbiased methodology and our articles are not intended to be financial advice. It does not constitute a recommendation to buy or sell any stock, and does not take account of your objectives, or your financial situation. We aim to bring you long-term focused analysis driven by fundamental data. Note that our analysis may not factor in the latest price-sensitive company announcements or qualitative material. Simply Wall St has no position in any stocks mentioned.
New: AI Stock Screener & Alerts
Our new AI Stock Screener scans the market every day to uncover opportunities.
• Dividend Powerhouses (3%+ Yield)
• Undervalued Small Caps with Insider Buying
• High growth Tech and AI Companies
Or build your own from over 50 metrics.
Have feedback on this article? Concerned about the content? Get in touch with us directly. Alternatively, email editorial-team@simplywallst.com
About TSX:CSU
Constellation Software
Acquires, builds, and manages vertical market software businesses to develop mission-critical software solutions for public and private sector markets.
Reasonable growth potential with adequate balance sheet.
Similar Companies
Market Insights


Advertisement
Weekly Picks
CE


Ceazar on Sparc AI ·
When GPS fails: this small cap is fixing a $54B drone problem
Fair Value:CA$5.2533.3% undervalued
157 followersusers have followed this narrative
0 commentsusers have commented on this narrative
26 likesusers have liked this narrative
HA


HarishPK on Amdocs ·
Why Amdocs is a high conviction Buy for me?
Fair Value:US$82.0328.6% undervalued
35 followersusers have followed this narrative
3 commentsusers have commented on this narrative
12 likesusers have liked this narrative
IV

Ivoed on SBM Offshore ·
Why SBM Offshore’s €30 Share Price May Be Too Harsh On Its Backlog
Fair Value:€44.527.2% undervalued
18 followersusers have followed this narrative
0 commentsusers have commented on this narrative
5 likesusers have liked this narrative
CL


Clive_Thompson on Green Tea Group ·
One of China's Fastest-Growing Restaurant Chains Trades on Just 7x Earnings and an 8% Dividend
Fair Value:HK$8.723.9% undervalued
47 followersusers have followed this narrative
3 commentsusers have commented on this narrative
20 likesusers have liked this narrative
Recently Updated Narratives
RO


RockeTeller on Southern Silver Exploration ·
302 Million Oz Silver Project in Mexico: Low Cost Underground Giant Ready to Explode
Fair Value:CA$32.198.0% undervalued
5 followersusers have followed this narrative
0 commentsusers have commented on this narrative
0 likesusers have liked this narrative
J_


J_Tyrader on Oscar Health ·
7/8/26 — Oscar Health: Trading 95.4% below Fair Value with +2070.2% Upside Potential
Fair Value:US$583.3495.2% undervalued
5 followersusers have followed this narrative
0 commentsusers have commented on this narrative
0 likesusers have liked this narrative
AN


andre_santos on Procter & Gamble ·
Procter & Gamble - A Fundamental Valuation
Fair Value:US$107.5235.6% overvalued
26 followersusers have followed this narrative
2 commentsusers have commented on this narrative
0 likesusers have liked this narrative
Popular Narratives
OS


oscargarcia on NVIDIA ·
The company that went from selling GPUs to gamers to becoming the AI arms dealer of the 21st century.
Fair Value:US$28020.0% undervalued
273 followersusers have followed this narrative
9 commentsusers have commented on this narrative
16 likesusers have liked this narrative
CU

CubanEros on Microsoft ·
A wonderful business at reasonable price.
Fair Value:US$419.9119.1% overvalued
141 followersusers have followed this narrative
0 commentsusers have commented on this narrative
8 likesusers have liked this narrative
KI

KiwiInvest on Amazon.com ·
Amazon's high growth, high tech segments propel its profits, while traditional segments plod along
Fair Value:US$475.0942.2% undervalued
166 followersusers have followed this narrative
1 commentusers have commented on this narrative
8 likesusers have liked this narrative
Trending Discussion
YA


Yash_Upadhyaya on Reddit ·
Steve blamed "choppy" Google referral traffic for the miss on US daily active user (DAU) WHILST being in a standoff with Google on the AI licensing deal... hmm 🤔 One way or another a deal is happening. What's gonna be interesting is to see how good or bad (which the market is pricing in) would it be. PS - I don't own the stock but like the company.
1
|0
