- Canada
- /
- Metals and Mining
- /
- TSXV:RBX
Under The Bonnet, Robex Resources' (CVE:RBX) Returns Look Impressive

If we want to find a stock that could multiply over the long term, what are the underlying trends we should look for? Typically, we'll want to notice a trend of growing return on capital employed (ROCE) and alongside that, an expanding base of capital employed. Put simply, these types of businesses are compounding machines, meaning they are continually reinvesting their earnings at ever-higher rates of return. With that in mind, the ROCE of Robex Resources (CVE:RBX) looks great, so lets see what the trend can tell us.
Return On Capital Employed (ROCE): What is it?
If you haven't worked with ROCE before, it measures the 'return' (pre-tax profit) a company generates from capital employed in its business. To calculate this metric for Robex Resources, this is the formula:
Return on Capital Employed = Earnings Before Interest and Tax (EBIT) ÷ (Total Assets - Current Liabilities)
0.35 = CA$37m ÷ (CA$143m - CA$35m) (Based on the trailing twelve months to December 2021).
So, Robex Resources has an ROCE of 35%. In absolute terms that's a great return and it's even better than the Metals and Mining industry average of 2.4%.
Check out our latest analysis for Robex Resources
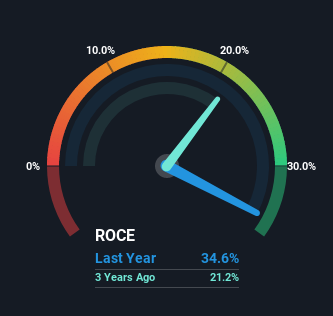
While the past is not representative of the future, it can be helpful to know how a company has performed historically, which is why we have this chart above. If you'd like to look at how Robex Resources has performed in the past in other metrics, you can view this free graph of past earnings, revenue and cash flow.
What The Trend Of ROCE Can Tell Us
We're delighted to see that Robex Resources is reaping rewards from its investments and is now generating some pre-tax profits. The company was generating losses five years ago, but now it's earning 35% which is a sight for sore eyes. And unsurprisingly, like most companies trying to break into the black, Robex Resources is utilizing 89% more capital than it was five years ago. This can tell us that the company has plenty of reinvestment opportunities that are able to generate higher returns.
In another part of our analysis, we noticed that the company's ratio of current liabilities to total assets decreased to 25%, which broadly means the business is relying less on its suppliers or short-term creditors to fund its operations. So this improvement in ROCE has come from the business' underlying economics, which is great to see.
The Key Takeaway
Long story short, we're delighted to see that Robex Resources' reinvestment activities have paid off and the company is now profitable. And with the stock having performed exceptionally well over the last five years, these patterns are being accounted for by investors. In light of that, we think it's worth looking further into this stock because if Robex Resources can keep these trends up, it could have a bright future ahead.
Robex Resources does have some risks though, and we've spotted 1 warning sign for Robex Resources that you might be interested in.
If you'd like to see other companies earning high returns, check out our free list of companies earning high returns with solid balance sheets here.
Mobile Infrastructure for Defense and Disaster
The next wave in robotics isn't humanoid. Its fully autonomous towers delivering 5G, ISR, and radar in under 30 minutes, anywhere.
Get the investor briefing before the next round of contracts
Sponsored On Behalf of CiTechNew: AI Stock Screener & Alerts
Our new AI Stock Screener scans the market every day to uncover opportunities.
• Dividend Powerhouses (3%+ Yield)
• Undervalued Small Caps with Insider Buying
• High growth Tech and AI Companies
Or build your own from over 50 metrics.
Have feedback on this article? Concerned about the content? Get in touch with us directly. Alternatively, email editorial-team (at) simplywallst.com.
This article by Simply Wall St is general in nature. We provide commentary based on historical data and analyst forecasts only using an unbiased methodology and our articles are not intended to be financial advice. It does not constitute a recommendation to buy or sell any stock, and does not take account of your objectives, or your financial situation. We aim to bring you long-term focused analysis driven by fundamental data. Note that our analysis may not factor in the latest price-sensitive company announcements or qualitative material. Simply Wall St has no position in any stocks mentioned.
About TSXV:RBX
Robex Resources
Engages in the exploration, development, and production of gold in West Africa.
Exceptional growth potential with flawless balance sheet.
Similar Companies
Market Insights

Weekly Picks

THE KINGDOM OF BROWN GOODS: WHY MGPI IS BEING CRUSHED BY INVENTORY & PRIMED FOR RESURRECTION


Why Vertical Aerospace (NYSE: EVTL) is Worth Possibly Over 13x its Current Price


The Quiet Giant That Became AI’s Power Grid
Recently Updated Narratives


MINISO's fair value is projected at 26.69 with an anticipated PE ratio shift of 20x

Fiverr International will transform the freelance industry with AI-powered growth

Stride Stock: Online Education Finds Its Second Act
Popular Narratives


MicroVision will explode future revenue by 380.37% with a vision towards success


Crazy Undervalued 42 Baggers Silver Play (Active & Running Mine)


