- Canada
- /
- Metals and Mining
- /
- TSXV:IB
These 4 Measures Indicate That IBC Advanced Alloys (CVE:IB) Is Using Debt Extensively

Some say volatility, rather than debt, is the best way to think about risk as an investor, but Warren Buffett famously said that 'Volatility is far from synonymous with risk.' When we think about how risky a company is, we always like to look at its use of debt, since debt overload can lead to ruin. As with many other companies IBC Advanced Alloys Corp. (CVE:IB) makes use of debt. But the more important question is: how much risk is that debt creating?
When Is Debt Dangerous?
Debt assists a business until the business has trouble paying it off, either with new capital or with free cash flow. Ultimately, if the company can't fulfill its legal obligations to repay debt, shareholders could walk away with nothing. However, a more frequent (but still costly) occurrence is where a company must issue shares at bargain-basement prices, permanently diluting shareholders, just to shore up its balance sheet. Of course, the upside of debt is that it often represents cheap capital, especially when it replaces dilution in a company with the ability to reinvest at high rates of return. The first thing to do when considering how much debt a business uses is to look at its cash and debt together.
Check out our latest analysis for IBC Advanced Alloys
How Much Debt Does IBC Advanced Alloys Carry?
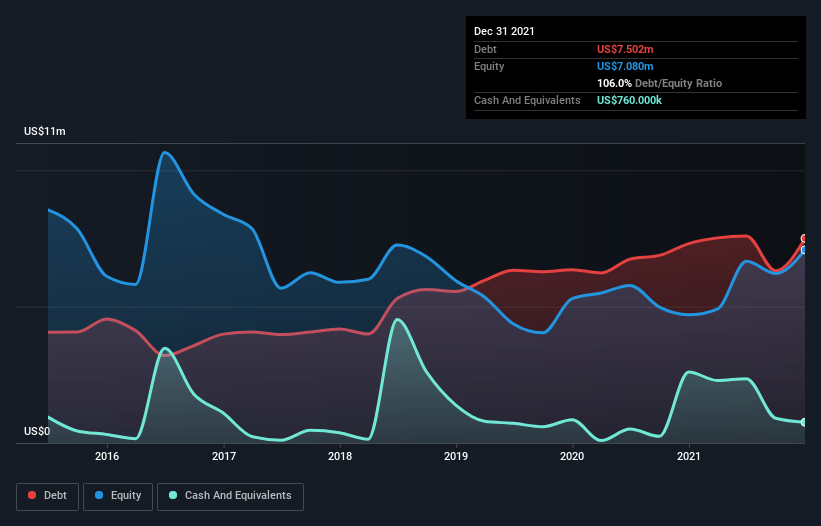
The chart below, which you can click on for greater detail, shows that IBC Advanced Alloys had US$7.50m in debt in December 2021; about the same as the year before. However, it also had US$760.0k in cash, and so its net debt is US$6.74m.
How Healthy Is IBC Advanced Alloys' Balance Sheet?
According to the last reported balance sheet, IBC Advanced Alloys had liabilities of US$10.0m due within 12 months, and liabilities of US$6.23m due beyond 12 months. Offsetting this, it had US$760.0k in cash and US$1.68m in receivables that were due within 12 months. So its liabilities total US$13.8m more than the combination of its cash and short-term receivables.
This is a mountain of leverage relative to its market capitalization of US$18.4m. Should its lenders demand that it shore up the balance sheet, shareholders would likely face severe dilution.
In order to size up a company's debt relative to its earnings, we calculate its net debt divided by its earnings before interest, tax, depreciation, and amortization (EBITDA) and its earnings before interest and tax (EBIT) divided by its interest expense (its interest cover). Thus we consider debt relative to earnings both with and without depreciation and amortization expenses.
While we wouldn't worry about IBC Advanced Alloys's net debt to EBITDA ratio of 3.1, we think its super-low interest cover of 0.82 times is a sign of high leverage. It seems that the business incurs large depreciation and amortisation charges, so maybe its debt load is heavier than it would first appear, since EBITDA is arguably a generous measure of earnings. So shareholders should probably be aware that interest expenses appear to have really impacted the business lately. One redeeming factor for IBC Advanced Alloys is that it turned last year's EBIT loss into a gain of US$1.1m, over the last twelve months. There's no doubt that we learn most about debt from the balance sheet. But it is IBC Advanced Alloys's earnings that will influence how the balance sheet holds up in the future. So when considering debt, it's definitely worth looking at the earnings trend. Click here for an interactive snapshot.
Finally, a company can only pay off debt with cold hard cash, not accounting profits. So it's worth checking how much of the earnings before interest and tax (EBIT) is backed by free cash flow. Over the last year, IBC Advanced Alloys saw substantial negative free cash flow, in total. While that may be a result of expenditure for growth, it does make the debt far more risky.
Our View
On the face of it, IBC Advanced Alloys's interest cover left us tentative about the stock, and its conversion of EBIT to free cash flow was no more enticing than the one empty restaurant on the busiest night of the year. Having said that, its ability to grow its EBIT isn't such a worry. We're quite clear that we consider IBC Advanced Alloys to be really rather risky, as a result of its balance sheet health. So we're almost as wary of this stock as a hungry kitten is about falling into its owner's fish pond: once bitten, twice shy, as they say. There's no doubt that we learn most about debt from the balance sheet. But ultimately, every company can contain risks that exist outside of the balance sheet. For example, we've discovered 4 warning signs for IBC Advanced Alloys that you should be aware of before investing here.
If you're interested in investing in businesses that can grow profits without the burden of debt, then check out this free list of growing businesses that have net cash on the balance sheet.
The New Payments ETF Is Live on NASDAQ:
Money is moving to real-time rails, and a newly listed ETF now gives investors direct exposure. Fast settlement. Institutional custody. Simple access.
Explore how this launch could reshape portfolios
Sponsored ContentNew: AI Stock Screener & Alerts
Our new AI Stock Screener scans the market every day to uncover opportunities.
• Dividend Powerhouses (3%+ Yield)
• Undervalued Small Caps with Insider Buying
• High growth Tech and AI Companies
Or build your own from over 50 metrics.
Have feedback on this article? Concerned about the content? Get in touch with us directly. Alternatively, email editorial-team (at) simplywallst.com.
This article by Simply Wall St is general in nature. We provide commentary based on historical data and analyst forecasts only using an unbiased methodology and our articles are not intended to be financial advice. It does not constitute a recommendation to buy or sell any stock, and does not take account of your objectives, or your financial situation. We aim to bring you long-term focused analysis driven by fundamental data. Note that our analysis may not factor in the latest price-sensitive company announcements or qualitative material. Simply Wall St has no position in any stocks mentioned.
About TSXV:IB
IBC Advanced Alloys
Develops, produces, and sells specialty alloy products in the United States, China, the Netherlands, Japan, Canada, Germany, South Korea, Taiwan, Italy, and internationally.
Mediocre balance sheet and slightly overvalued.
Similar Companies
Market Insights

Weekly Picks

THE KINGDOM OF BROWN GOODS: WHY MGPI IS BEING CRUSHED BY INVENTORY & PRIMED FOR RESURRECTION


Why Vertical Aerospace (NYSE: EVTL) is Worth Possibly Over 13x its Current Price


The Quiet Giant That Became AI’s Power Grid
Recently Updated Narratives


A case for USD $14.81 per share based on book value. Be warned, this is a micro-cap dependent on a single mine.

Occidental Petroleum to Become Fairly Priced at $68.29 According to Future Projections

Agfa-Gevaert is a digital and materials turnaround opportunity, with growth potential in ZIRFON, but carrying legacy risks.
Popular Narratives


MicroVision will explode future revenue by 380.37% with a vision towards success


Crazy Undervalued 42 Baggers Silver Play (Active & Running Mine)


