
The external fund manager backed by Berkshire Hathaway's Charlie Munger, Li Lu, makes no bones about it when he says 'The biggest investment risk is not the volatility of prices, but whether you will suffer a permanent loss of capital.' So it might be obvious that you need to consider debt, when you think about how risky any given stock is, because too much debt can sink a company. Importantly, Regenx Tech Corp. (CSE:RGX) does carry debt. But is this debt a concern to shareholders?
When Is Debt Dangerous?
Debt and other liabilities become risky for a business when it cannot easily fulfill those obligations, either with free cash flow or by raising capital at an attractive price. Ultimately, if the company can't fulfill its legal obligations to repay debt, shareholders could walk away with nothing. However, a more usual (but still expensive) situation is where a company must dilute shareholders at a cheap share price simply to get debt under control. Of course, debt can be an important tool in businesses, particularly capital heavy businesses. The first step when considering a company's debt levels is to consider its cash and debt together.
Check out our latest analysis for Regenx Tech
What Is Regenx Tech's Net Debt?
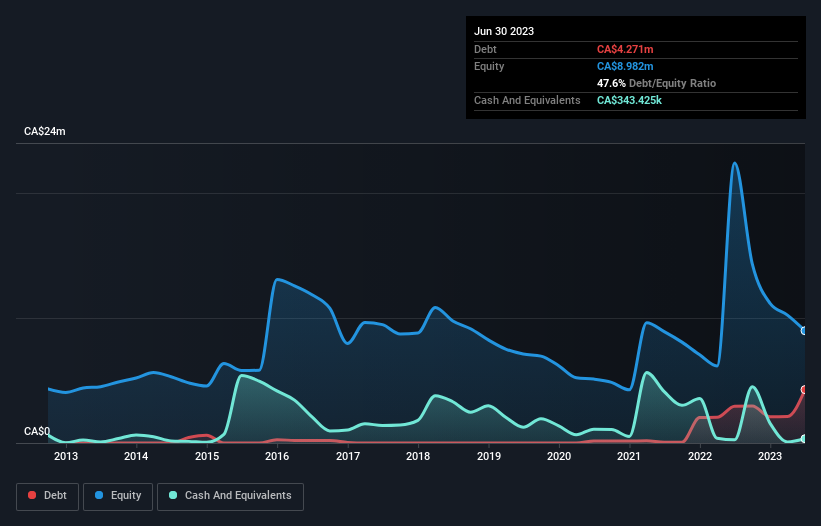
You can click the graphic below for the historical numbers, but it shows that as of June 2023 Regenx Tech had CA$4.27m of debt, an increase on CA$2.94m, over one year. However, it does have CA$343.4k in cash offsetting this, leading to net debt of about CA$3.93m.
A Look At Regenx Tech's Liabilities
Zooming in on the latest balance sheet data, we can see that Regenx Tech had liabilities of CA$314.6k due within 12 months and liabilities of CA$4.74m due beyond that. Offsetting this, it had CA$343.4k in cash and CA$16.9k in receivables that were due within 12 months. So it has liabilities totalling CA$4.69m more than its cash and near-term receivables, combined.
Given Regenx Tech has a market capitalization of CA$33.5m, it's hard to believe these liabilities pose much threat. But there are sufficient liabilities that we would certainly recommend shareholders continue to monitor the balance sheet, going forward. The balance sheet is clearly the area to focus on when you are analysing debt. But you can't view debt in total isolation; since Regenx Tech will need earnings to service that debt. So if you're keen to discover more about its earnings, it might be worth checking out this graph of its long term earnings trend.
Since Regenx Tech has no significant operating revenue, shareholders probably hope it will develop a valuable new mine before too long.
Caveat Emptor
Importantly, Regenx Tech had an earnings before interest and tax (EBIT) loss over the last year. Its EBIT loss was a whopping CA$3.8m. Considering that alongside the liabilities mentioned above does not give us much confidence that company should be using so much debt. So we think its balance sheet is a little strained, though not beyond repair. Another cause for caution is that is bled CA$5.7m in negative free cash flow over the last twelve months. So in short it's a really risky stock. When analysing debt levels, the balance sheet is the obvious place to start. However, not all investment risk resides within the balance sheet - far from it. We've identified 5 warning signs with Regenx Tech (at least 3 which are a bit unpleasant) , and understanding them should be part of your investment process.
At the end of the day, it's often better to focus on companies that are free from net debt. You can access our special list of such companies (all with a track record of profit growth). It's free.
The New Payments ETF Is Live on NASDAQ:
Money is moving to real-time rails, and a newly listed ETF now gives investors direct exposure. Fast settlement. Institutional custody. Simple access.
Explore how this launch could reshape portfolios
Sponsored ContentNew: AI Stock Screener & Alerts
Our new AI Stock Screener scans the market every day to uncover opportunities.
• Dividend Powerhouses (3%+ Yield)
• Undervalued Small Caps with Insider Buying
• High growth Tech and AI Companies
Or build your own from over 50 metrics.
Have feedback on this article? Concerned about the content? Get in touch with us directly. Alternatively, email editorial-team (at) simplywallst.com.
This article by Simply Wall St is general in nature. We provide commentary based on historical data and analyst forecasts only using an unbiased methodology and our articles are not intended to be financial advice. It does not constitute a recommendation to buy or sell any stock, and does not take account of your objectives, or your financial situation. We aim to bring you long-term focused analysis driven by fundamental data. Note that our analysis may not factor in the latest price-sensitive company announcements or qualitative material. Simply Wall St has no position in any stocks mentioned.
About CNSX:RGX
Regenx Tech
Engages in the exploration and development of mineral properties in Spain and North America.
Moderate risk with weak fundamentals.
Market Insights

Weekly Picks

THE KINGDOM OF BROWN GOODS: WHY MGPI IS BEING CRUSHED BY INVENTORY & PRIMED FOR RESURRECTION


Why Vertical Aerospace (NYSE: EVTL) is Worth Possibly Over 13x its Current Price


The Quiet Giant That Became AI’s Power Grid
Recently Updated Narratives


MINISO's fair value is projected at 26.69 with an anticipated PE ratio shift of 20x

Fiverr International will transform the freelance industry with AI-powered growth

Stride Stock: Online Education Finds Its Second Act
Popular Narratives


MicroVision will explode future revenue by 380.37% with a vision towards success


Crazy Undervalued 42 Baggers Silver Play (Active & Running Mine)


