- Canada
- /
- Trade Distributors
- /
- TSX:FTT
Finning International (TSE:FTT) Knows How To Allocate Capital Effectively


Did you know there are some financial metrics that can provide clues of a potential multi-bagger? In a perfect world, we'd like to see a company investing more capital into its business and ideally the returns earned from that capital are also increasing. If you see this, it typically means it's a company with a great business model and plenty of profitable reinvestment opportunities. So when we looked at the ROCE trend of Finning International (TSE:FTT) we really liked what we saw.
Understanding Return On Capital Employed (ROCE)
If you haven't worked with ROCE before, it measures the 'return' (pre-tax profit) a company generates from capital employed in its business. Analysts use this formula to calculate it for Finning International:
Return on Capital Employed = Earnings Before Interest and Tax (EBIT) ÷ (Total Assets - Current Liabilities)
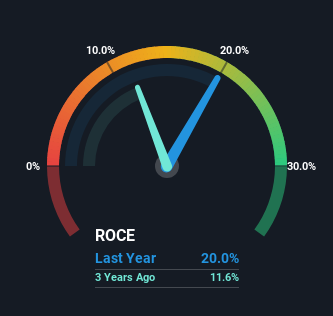
0.20 = CA$905m ÷ (CA$8.0b - CA$3.5b) (Based on the trailing twelve months to June 2024).
Therefore, Finning International has an ROCE of 20%. In absolute terms that's a great return and it's even better than the Trade Distributors industry average of 13%.
Check out our latest analysis for Finning International
Above you can see how the current ROCE for Finning International compares to its prior returns on capital, but there's only so much you can tell from the past. If you'd like, you can check out the forecasts from the analysts covering Finning International for free.
The Trend Of ROCE
Finning International's ROCE growth is quite impressive. The figures show that over the last five years, ROCE has grown 81% whilst employing roughly the same amount of capital. Basically the business is generating higher returns from the same amount of capital and that is proof that there are improvements in the company's efficiencies. On that front, things are looking good so it's worth exploring what management has said about growth plans going forward.
Another thing to note, Finning International has a high ratio of current liabilities to total assets of 44%. This effectively means that suppliers (or short-term creditors) are funding a large portion of the business, so just be aware that this can introduce some elements of risk. While it's not necessarily a bad thing, it can be beneficial if this ratio is lower.
The Bottom Line
As discussed above, Finning International appears to be getting more proficient at generating returns since capital employed has remained flat but earnings (before interest and tax) are up. And a remarkable 106% total return over the last five years tells us that investors are expecting more good things to come in the future. So given the stock has proven it has promising trends, it's worth researching the company further to see if these trends are likely to persist.
Finning International does have some risks though, and we've spotted 1 warning sign for Finning International that you might be interested in.
High returns are a key ingredient to strong performance, so check out our free list ofstocks earning high returns on equity with solid balance sheets.
If you're looking to trade Finning International, open an account with the lowest-cost platform trusted by professionals, Interactive Brokers.
With clients in over 200 countries and territories, and access to 160 markets, IBKR lets you trade stocks, options, futures, forex, bonds and funds from a single integrated account.
Enjoy no hidden fees, no account minimums, and FX conversion rates as low as 0.03%, far better than what most brokers offer.
Sponsored ContentNew: AI Stock Screener & Alerts
Our new AI Stock Screener scans the market every day to uncover opportunities.
• Dividend Powerhouses (3%+ Yield)
• Undervalued Small Caps with Insider Buying
• High growth Tech and AI Companies
Or build your own from over 50 metrics.
Have feedback on this article? Concerned about the content? Get in touch with us directly. Alternatively, email editorial-team (at) simplywallst.com.
This article by Simply Wall St is general in nature. We provide commentary based on historical data and analyst forecasts only using an unbiased methodology and our articles are not intended to be financial advice. It does not constitute a recommendation to buy or sell any stock, and does not take account of your objectives, or your financial situation. We aim to bring you long-term focused analysis driven by fundamental data. Note that our analysis may not factor in the latest price-sensitive company announcements or qualitative material. Simply Wall St has no position in any stocks mentioned.
About TSX:FTT
Finning International
Sells, services, and rents heavy equipment, engines, and related products in Canada, Chile, the United Kingdom, Argentina, and internationally.
Very undervalued established dividend payer.
Similar Companies
Market Insights

Community Narratives
