- Australia
- /
- Specialty Stores
- /
- ASX:MTO
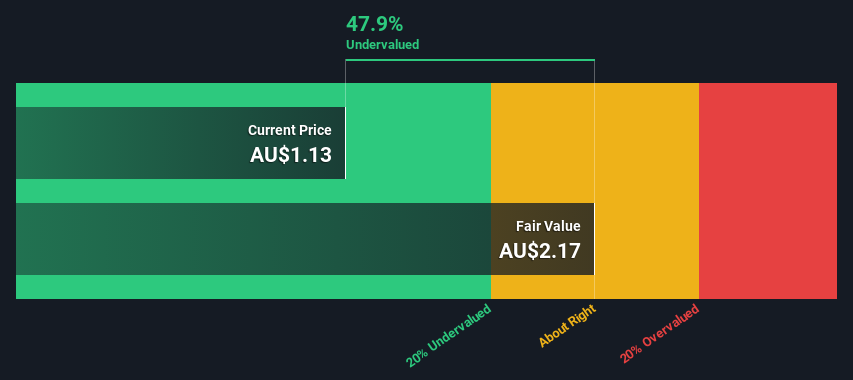
Are Investors Undervaluing MotorCycle Holdings Limited (ASX:MTO) By 48%?


Key Insights
- MotorCycle Holdings' estimated fair value is AU$2.17 based on 2 Stage Free Cash Flow to Equity
- MotorCycle Holdings is estimated to be 48% undervalued based on current share price of AU$1.13
- The AU$1.65 analyst price target for MTO is 24% less than our estimate of fair value
Today we will run through one way of estimating the intrinsic value of MotorCycle Holdings Limited (ASX:MTO) by projecting its future cash flows and then discounting them to today's value. The Discounted Cash Flow (DCF) model is the tool we will apply to do this. It may sound complicated, but actually it is quite simple!
Remember though, that there are many ways to estimate a company's value, and a DCF is just one method. For those who are keen learners of equity analysis, the Simply Wall St analysis model here may be something of interest to you.
Check out our latest analysis for MotorCycle Holdings
The Model
We are going to use a two-stage DCF model, which, as the name states, takes into account two stages of growth. The first stage is generally a higher growth period which levels off heading towards the terminal value, captured in the second 'steady growth' period. In the first stage we need to estimate the cash flows to the business over the next ten years. Where possible we use analyst estimates, but when these aren't available we extrapolate the previous free cash flow (FCF) from the last estimate or reported value. We assume companies with shrinking free cash flow will slow their rate of shrinkage, and that companies with growing free cash flow will see their growth rate slow, over this period. We do this to reflect that growth tends to slow more in the early years than it does in later years.
Generally we assume that a dollar today is more valuable than a dollar in the future, so we need to discount the sum of these future cash flows to arrive at a present value estimate:
10-year free cash flow (FCF) forecast
| 2025 | 2026 | 2027 | 2028 | 2029 | 2030 | 2031 | 2032 | 2033 | 2034 | |
| Levered FCF (A$, Millions) | AU$13.2m | AU$13.1m | AU$13.1m | AU$13.2m | AU$13.4m | AU$13.6m | AU$13.9m | AU$14.1m | AU$14.4m | AU$14.8m |
| Growth Rate Estimate Source | Analyst x2 | Analyst x2 | Est @ 0.23% | Est @ 0.88% | Est @ 1.34% | Est @ 1.66% | Est @ 1.89% | Est @ 2.04% | Est @ 2.15% | Est @ 2.23% |
| Present Value (A$, Millions) Discounted @ 10.0% | AU$12.0 | AU$10.8 | AU$9.8 | AU$9.0 | AU$8.3 | AU$7.7 | AU$7.1 | AU$6.6 | AU$6.1 | AU$5.7 |
("Est" = FCF growth rate estimated by Simply Wall St)
Present Value of 10-year Cash Flow (PVCF) = AU$83m
After calculating the present value of future cash flows in the initial 10-year period, we need to calculate the Terminal Value, which accounts for all future cash flows beyond the first stage. For a number of reasons a very conservative growth rate is used that cannot exceed that of a country's GDP growth. In this case we have used the 5-year average of the 10-year government bond yield (2.4%) to estimate future growth. In the same way as with the 10-year 'growth' period, we discount future cash flows to today's value, using a cost of equity of 10.0%.
Terminal Value (TV)= FCF2034 × (1 + g) ÷ (r – g) = AU$15m× (1 + 2.4%) ÷ (10.0%– 2.4%) = AU$199m
Present Value of Terminal Value (PVTV)= TV / (1 + r)10= AU$199m÷ ( 1 + 10.0%)10= AU$77m
The total value is the sum of cash flows for the next ten years plus the discounted terminal value, which results in the Total Equity Value, which in this case is AU$160m. In the final step we divide the equity value by the number of shares outstanding. Relative to the current share price of AU$1.1, the company appears quite good value at a 48% discount to where the stock price trades currently. Valuations are imprecise instruments though, rather like a telescope - move a few degrees and end up in a different galaxy. Do keep this in mind.
The Assumptions
The calculation above is very dependent on two assumptions. The first is the discount rate and the other is the cash flows. If you don't agree with these result, have a go at the calculation yourself and play with the assumptions. The DCF also does not consider the possible cyclicality of an industry, or a company's future capital requirements, so it does not give a full picture of a company's potential performance. Given that we are looking at MotorCycle Holdings as potential shareholders, the cost of equity is used as the discount rate, rather than the cost of capital (or weighted average cost of capital, WACC) which accounts for debt. In this calculation we've used 10.0%, which is based on a levered beta of 1.841. Beta is a measure of a stock's volatility, compared to the market as a whole. We get our beta from the industry average beta of globally comparable companies, with an imposed limit between 0.8 and 2.0, which is a reasonable range for a stable business.
SWOT Analysis for MotorCycle Holdings
- Debt is well covered by earnings and cashflows.
- Dividends are covered by earnings and cash flows.
- Dividend is in the top 25% of dividend payers in the market.
- Earnings declined over the past year.
- Good value based on P/E ratio and estimated fair value.
- Annual earnings are forecast to decline for the next 3 years.
Looking Ahead:
Whilst important, the DCF calculation ideally won't be the sole piece of analysis you scrutinize for a company. It's not possible to obtain a foolproof valuation with a DCF model. Preferably you'd apply different cases and assumptions and see how they would impact the company's valuation. For example, changes in the company's cost of equity or the risk free rate can significantly impact the valuation. What is the reason for the share price sitting below the intrinsic value? For MotorCycle Holdings, we've compiled three important aspects you should further examine:
- Risks: To that end, you should learn about the 4 warning signs we've spotted with MotorCycle Holdings (including 1 which is a bit unpleasant) .
- Future Earnings: How does MTO's growth rate compare to its peers and the wider market? Dig deeper into the analyst consensus number for the upcoming years by interacting with our free analyst growth expectation chart.
- Other High Quality Alternatives: Do you like a good all-rounder? Explore our interactive list of high quality stocks to get an idea of what else is out there you may be missing!
PS. The Simply Wall St app conducts a discounted cash flow valuation for every stock on the ASX every day. If you want to find the calculation for other stocks just search here.
If you're looking to trade MotorCycle Holdings, open an account with the lowest-cost platform trusted by professionals, Interactive Brokers.
With clients in over 200 countries and territories, and access to 160 markets, IBKR lets you trade stocks, options, futures, forex, bonds and funds from a single integrated account.
Enjoy no hidden fees, no account minimums, and FX conversion rates as low as 0.03%, far better than what most brokers offer.
Sponsored ContentNew: Manage All Your Stock Portfolios in One Place
We've created the ultimate portfolio companion for stock investors, and it's free.
• Connect an unlimited number of Portfolios and see your total in one currency
• Be alerted to new Warning Signs or Risks via email or mobile
• Track the Fair Value of your stocks
Have feedback on this article? Concerned about the content? Get in touch with us directly. Alternatively, email editorial-team (at) simplywallst.com.
This article by Simply Wall St is general in nature. We provide commentary based on historical data and analyst forecasts only using an unbiased methodology and our articles are not intended to be financial advice. It does not constitute a recommendation to buy or sell any stock, and does not take account of your objectives, or your financial situation. We aim to bring you long-term focused analysis driven by fundamental data. Note that our analysis may not factor in the latest price-sensitive company announcements or qualitative material. Simply Wall St has no position in any stocks mentioned.
About ASX:MTO
MotorCycle Holdings
Owns and operates motorcycle dealerships in Australia.
Flawless balance sheet and good value.
Similar Companies
Market Insights

Community Narratives


