- Australia
- /
- Real Estate
- /
- ASX:FRI
These 4 Measures Indicate That Finbar Group (ASX:FRI) Is Using Debt Reasonably Well

Some say volatility, rather than debt, is the best way to think about risk as an investor, but Warren Buffett famously said that 'Volatility is far from synonymous with risk.' It's only natural to consider a company's balance sheet when you examine how risky it is, since debt is often involved when a business collapses. We can see that Finbar Group Limited (ASX:FRI) does use debt in its business. But should shareholders be worried about its use of debt?
When Is Debt A Problem?
Debt assists a business until the business has trouble paying it off, either with new capital or with free cash flow. Part and parcel of capitalism is the process of 'creative destruction' where failed businesses are mercilessly liquidated by their bankers. However, a more usual (but still expensive) situation is where a company must dilute shareholders at a cheap share price simply to get debt under control. Of course, the upside of debt is that it often represents cheap capital, especially when it replaces dilution in a company with the ability to reinvest at high rates of return. When we examine debt levels, we first consider both cash and debt levels, together.
What Is Finbar Group's Net Debt?
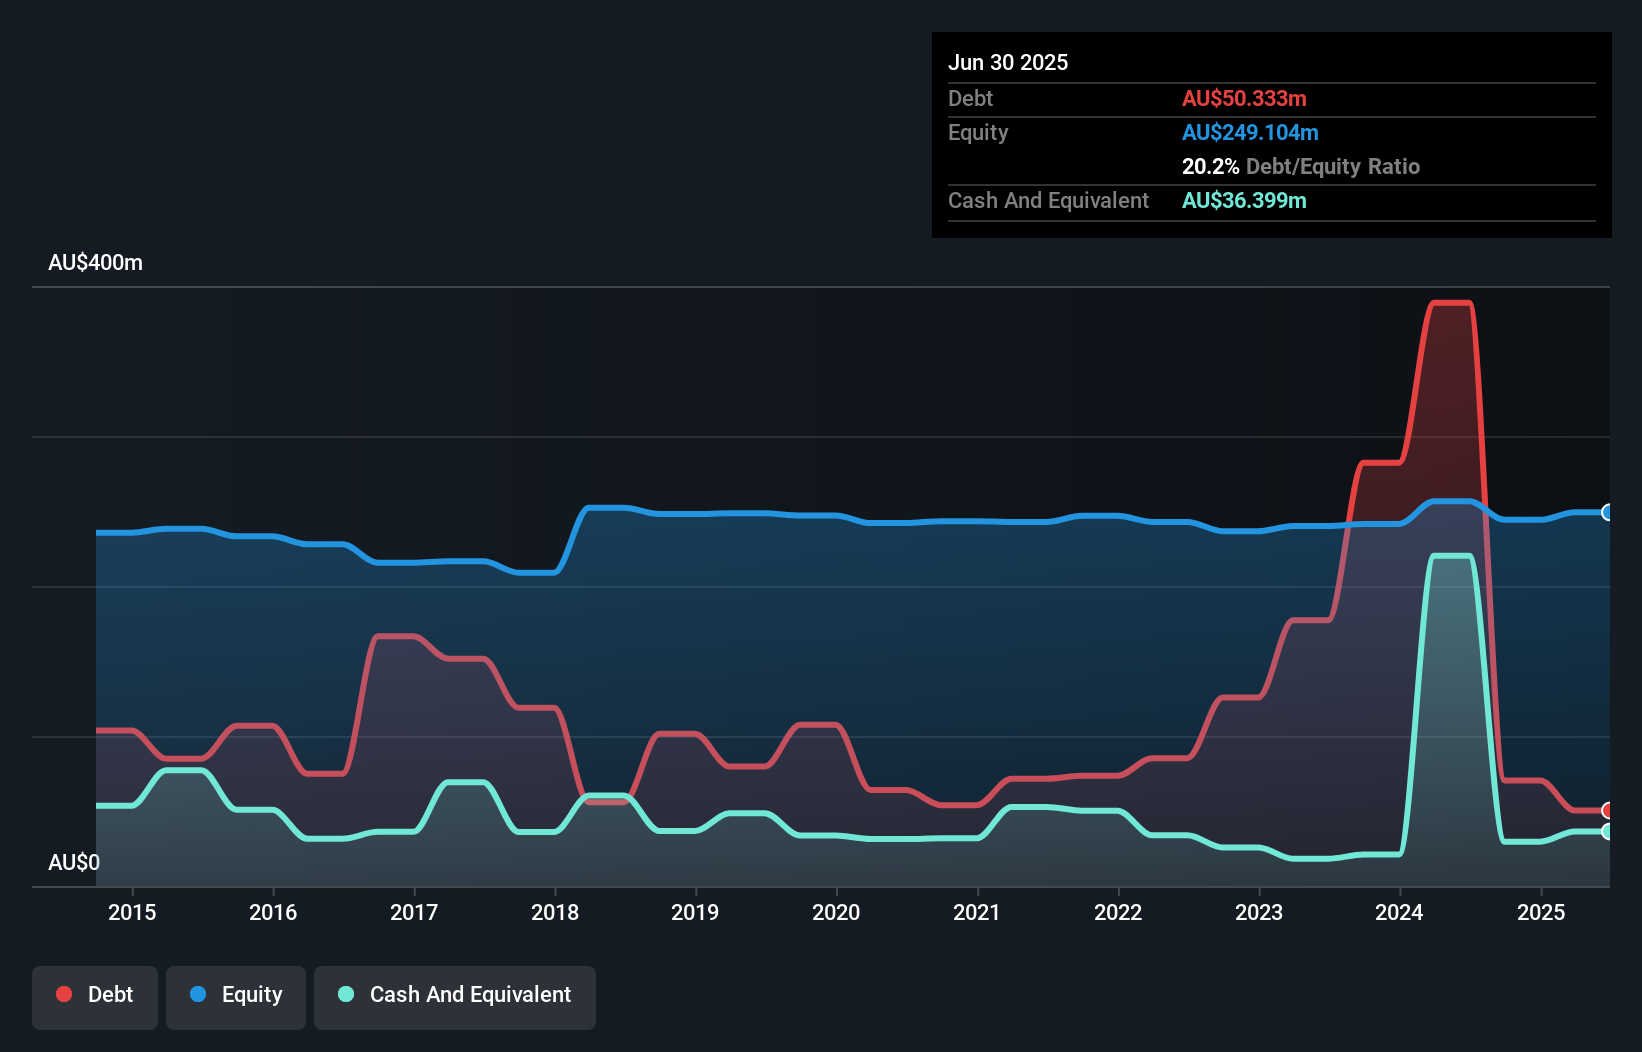
You can click the graphic below for the historical numbers, but it shows that Finbar Group had AU$50.3m of debt in June 2025, down from AU$388.8m, one year before. However, it also had AU$36.4m in cash, and so its net debt is AU$13.9m.
A Look At Finbar Group's Liabilities
According to the last reported balance sheet, Finbar Group had liabilities of AU$71.1m due within 12 months, and liabilities of AU$40.0m due beyond 12 months. Offsetting these obligations, it had cash of AU$36.4m as well as receivables valued at AU$8.14m due within 12 months. So its liabilities outweigh the sum of its cash and (near-term) receivables by AU$66.5m.
Finbar Group has a market capitalization of AU$216.3m, so it could very likely raise cash to ameliorate its balance sheet, if the need arose. However, it is still worthwhile taking a close look at its ability to pay off debt.
See our latest analysis for Finbar Group
We use two main ratios to inform us about debt levels relative to earnings. The first is net debt divided by earnings before interest, tax, depreciation, and amortization (EBITDA), while the second is how many times its earnings before interest and tax (EBIT) covers its interest expense (or its interest cover, for short). The advantage of this approach is that we take into account both the absolute quantum of debt (with net debt to EBITDA) and the actual interest expenses associated with that debt (with its interest cover ratio).
Finbar Group has a low net debt to EBITDA ratio of only 0.63. And its EBIT covers its interest expense a whopping 43.1 times over. So we're pretty relaxed about its super-conservative use of debt. But the other side of the story is that Finbar Group saw its EBIT decline by 3.1% over the last year. If earnings continue to decline at that rate the company may have increasing difficulty managing its debt load. There's no doubt that we learn most about debt from the balance sheet. But you can't view debt in total isolation; since Finbar Group will need earnings to service that debt. So if you're keen to discover more about its earnings, it might be worth checking out this graph of its long term earnings trend.
But our final consideration is also important, because a company cannot pay debt with paper profits; it needs cold hard cash. So we clearly need to look at whether that EBIT is leading to corresponding free cash flow. Over the last three years, Finbar Group actually produced more free cash flow than EBIT. That sort of strong cash conversion gets us as excited as the crowd when the beat drops at a Daft Punk concert.
Our View
Finbar Group's interest cover suggests it can handle its debt as easily as Cristiano Ronaldo could score a goal against an under 14's goalkeeper. But truth be told we feel its EBIT growth rate does undermine this impression a bit. Taking all this data into account, it seems to us that Finbar Group takes a pretty sensible approach to debt. That means they are taking on a bit more risk, in the hope of boosting shareholder returns. The balance sheet is clearly the area to focus on when you are analysing debt. However, not all investment risk resides within the balance sheet - far from it. We've identified 2 warning signs with Finbar Group , and understanding them should be part of your investment process.
When all is said and done, sometimes its easier to focus on companies that don't even need debt. Readers can access a list of growth stocks with zero net debt 100% free, right now.
The New Payments ETF Is Live on NASDAQ:
Money is moving to real-time rails, and a newly listed ETF now gives investors direct exposure. Fast settlement. Institutional custody. Simple access.
Explore how this launch could reshape portfolios
Sponsored ContentNew: AI Stock Screener & Alerts
Our new AI Stock Screener scans the market every day to uncover opportunities.
• Dividend Powerhouses (3%+ Yield)
• Undervalued Small Caps with Insider Buying
• High growth Tech and AI Companies
Or build your own from over 50 metrics.
Have feedback on this article? Concerned about the content? Get in touch with us directly. Alternatively, email editorial-team (at) simplywallst.com.
This article by Simply Wall St is general in nature. We provide commentary based on historical data and analyst forecasts only using an unbiased methodology and our articles are not intended to be financial advice. It does not constitute a recommendation to buy or sell any stock, and does not take account of your objectives, or your financial situation. We aim to bring you long-term focused analysis driven by fundamental data. Note that our analysis may not factor in the latest price-sensitive company announcements or qualitative material. Simply Wall St has no position in any stocks mentioned.
About ASX:FRI
Finbar Group
Engages in the property development and investment business in Australia.
Flawless balance sheet and slightly overvalued.
Market Insights

Weekly Picks

THE KINGDOM OF BROWN GOODS: WHY MGPI IS BEING CRUSHED BY INVENTORY & PRIMED FOR RESURRECTION


Why Vertical Aerospace (NYSE: EVTL) is Worth Possibly Over 13x its Current Price


The Quiet Giant That Became AI’s Power Grid
Recently Updated Narratives


A case for USD $14.81 per share based on book value. Be warned, this is a micro-cap dependent on a single mine.

Occidental Petroleum to Become Fairly Priced at $68.29 According to Future Projections

Agfa-Gevaert is a digital and materials turnaround opportunity, with growth potential in ZIRFON, but carrying legacy risks.
Popular Narratives


MicroVision will explode future revenue by 380.37% with a vision towards success


Crazy Undervalued 42 Baggers Silver Play (Active & Running Mine)


