- Australia
- /
- Metals and Mining
- /
- ASX:VAU
Do Its Financials Have Any Role To Play In Driving Red 5 Limited's (ASX:RED) Stock Up Recently?


Red 5's (ASX:RED) stock is up by a considerable 44% over the past three months. Given that stock prices are usually aligned with a company's financial performance in the long-term, we decided to study its financial indicators more closely to see if they had a hand to play in the recent price move. Particularly, we will be paying attention to Red 5's ROE today.
Return on equity or ROE is a key measure used to assess how efficiently a company's management is utilizing the company's capital. In other words, it is a profitability ratio which measures the rate of return on the capital provided by the company's shareholders.
Check out our latest analysis for Red 5
How Is ROE Calculated?
ROE can be calculated by using the formula:
Return on Equity = Net Profit (from continuing operations) ÷ Shareholders' Equity
So, based on the above formula, the ROE for Red 5 is:
14% = AU$49m ÷ AU$356m (Based on the trailing twelve months to December 2023).
The 'return' is the amount earned after tax over the last twelve months. Another way to think of that is that for every A$1 worth of equity, the company was able to earn A$0.14 in profit.
What Has ROE Got To Do With Earnings Growth?
We have already established that ROE serves as an efficient profit-generating gauge for a company's future earnings. Based on how much of its profits the company chooses to reinvest or "retain", we are then able to evaluate a company's future ability to generate profits. Assuming all else is equal, companies that have both a higher return on equity and higher profit retention are usually the ones that have a higher growth rate when compared to companies that don't have the same features.
Red 5's Earnings Growth And 14% ROE
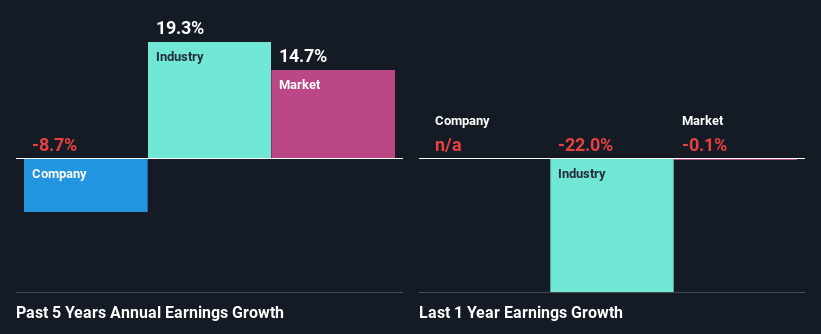
To begin with, Red 5 seems to have a respectable ROE. Further, the company's ROE compares quite favorably to the industry average of 10%. As you might expect, the 8.7% net income decline reported by Red 5 is a bit of a surprise. We reckon that there could be some other factors at play here that are preventing the company's growth. These include low earnings retention or poor allocation of capital.
However, when we compared Red 5's growth with the industry we found that while the company's earnings have been shrinking, the industry has seen an earnings growth of 19% in the same period. This is quite worrisome.
Earnings growth is an important metric to consider when valuing a stock. What investors need to determine next is if the expected earnings growth, or the lack of it, is already built into the share price. Doing so will help them establish if the stock's future looks promising or ominous. One good indicator of expected earnings growth is the P/E ratio which determines the price the market is willing to pay for a stock based on its earnings prospects. So, you may want to check if Red 5 is trading on a high P/E or a low P/E, relative to its industry.
Is Red 5 Making Efficient Use Of Its Profits?
Because Red 5 doesn't pay any regular dividends, we infer that it is retaining all of its profits, which is rather perplexing when you consider the fact that there is no earnings growth to show for it. So there could be some other explanations in that regard. For instance, the company's business may be deteriorating.
Conclusion
On the whole, we do feel that Red 5 has some positive attributes. However, given the high ROE and high profit retention, we would expect the company to be delivering strong earnings growth, but that isn't the case here. This suggests that there might be some external threat to the business, that's hampering its growth. With that said, we studied the latest analyst forecasts and found that while the company has shrunk its earnings in the past, analysts expect its earnings to grow in the future. To know more about the latest analysts predictions for the company, check out this visualization of analyst forecasts for the company.
New: Manage All Your Stock Portfolios in One Place
We've created the ultimate portfolio companion for stock investors, and it's free.
• Connect an unlimited number of Portfolios and see your total in one currency
• Be alerted to new Warning Signs or Risks via email or mobile
• Track the Fair Value of your stocks
Have feedback on this article? Concerned about the content? Get in touch with us directly. Alternatively, email editorial-team (at) simplywallst.com.
This article by Simply Wall St is general in nature. We provide commentary based on historical data and analyst forecasts only using an unbiased methodology and our articles are not intended to be financial advice. It does not constitute a recommendation to buy or sell any stock, and does not take account of your objectives, or your financial situation. We aim to bring you long-term focused analysis driven by fundamental data. Note that our analysis may not factor in the latest price-sensitive company announcements or qualitative material. Simply Wall St has no position in any stocks mentioned.
About ASX:VAU
Vault Minerals
Engages in the exploration, production, and mining of gold and gold/copper concentrates in Canada and Australia.
Flawless balance sheet and good value.
