
Advertisement
The three-year shareholder returns and company earnings persist lower as Orora (ASX:ORA) stock falls a further 4.3% in past week
For many investors, the main point of stock picking is to generate higher returns than the overall market. But if you try your hand at stock picking, you risk returning less than the market. We regret to report that long term Orora Limited (ASX:ORA) shareholders have had that experience, with the share price dropping 51% in three years, versus a market return of about 28%. Furthermore, it's down 11% in about a quarter. That's not much fun for holders.
After losing 4.3% this past week, it's worth investigating the company's fundamentals to see what we can infer from past performance.
To paraphrase Benjamin Graham: Over the short term the market is a voting machine, but over the long term it's a weighing machine. By comparing earnings per share (EPS) and share price changes over time, we can get a feel for how investor attitudes to a company have morphed over time.
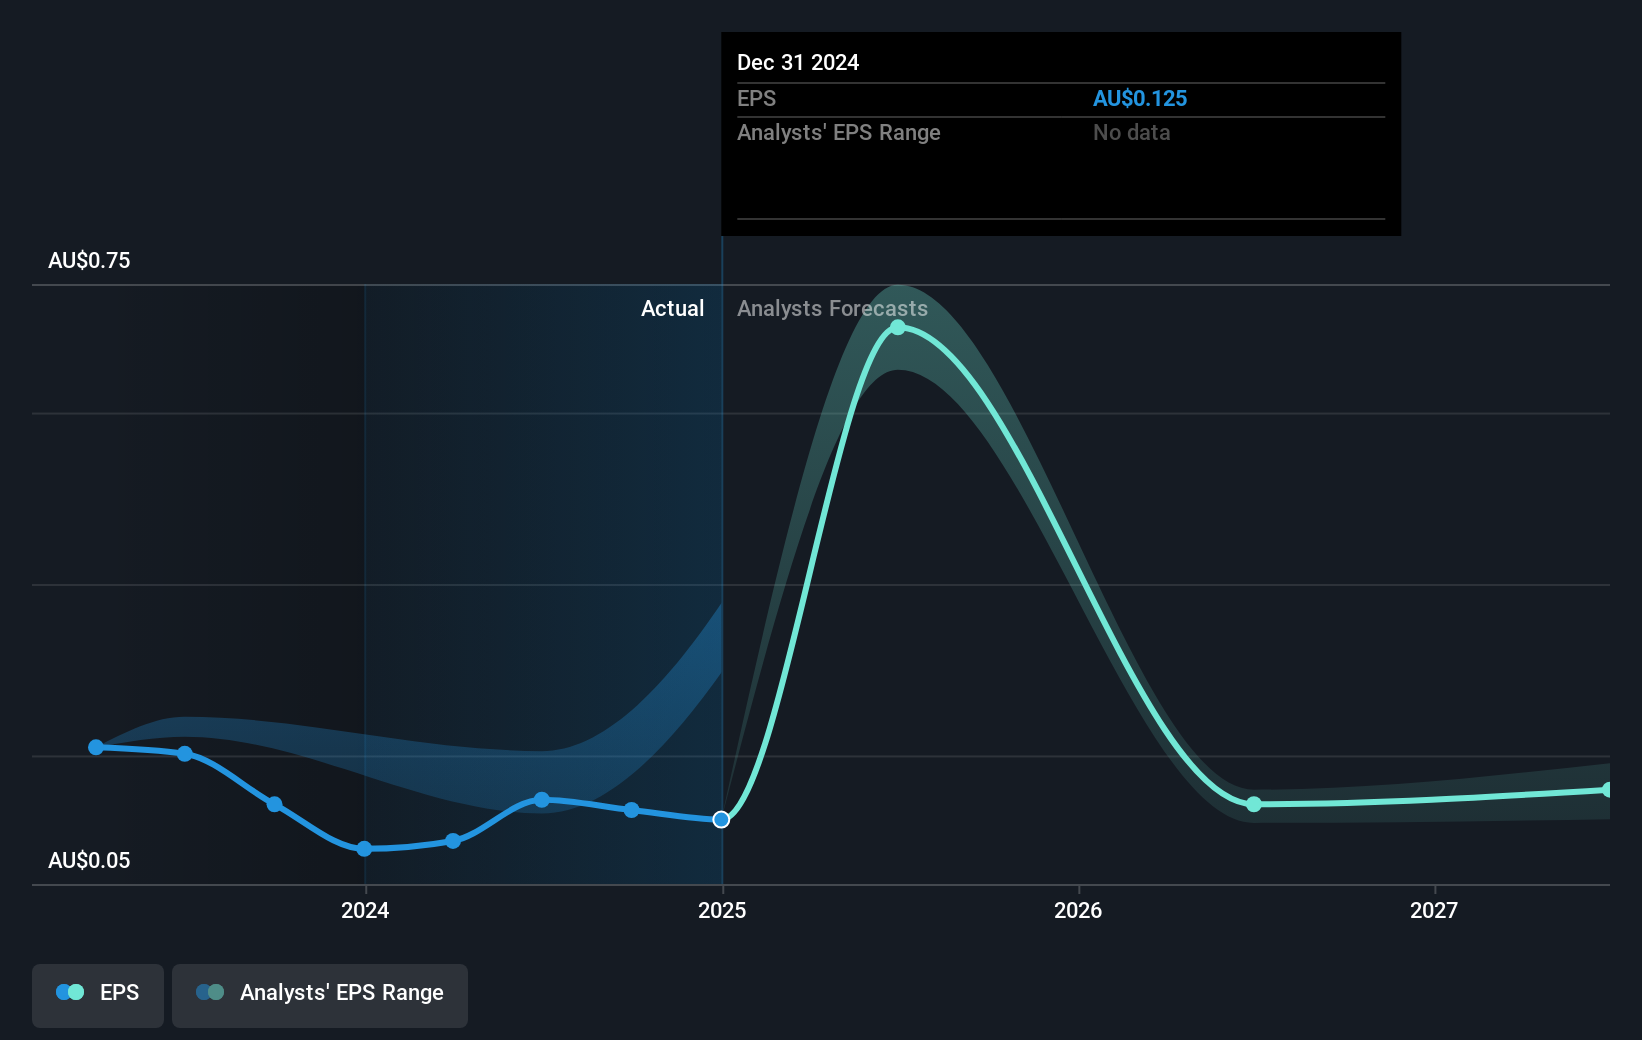
During the three years that the share price fell, Orora's earnings per share (EPS) dropped by 7.9% each year. This reduction in EPS is slower than the 21% annual reduction in the share price. So it seems the market was too confident about the business, in the past.
The company's earnings per share (over time) is depicted in the image below (click to see the exact numbers).
It's probably worth noting we've seen significant insider buying in the last quarter, which we consider a positive. On the other hand, we think the revenue and earnings trends are much more meaningful measures of the business. This free interactive report on Orora's earnings, revenue and cash flow is a great place to start, if you want to investigate the stock further.

What About Dividends?
When looking at investment returns, it is important to consider the difference between total shareholder return (TSR) and share price return. Whereas the share price return only reflects the change in the share price, the TSR includes the value of dividends (assuming they were reinvested) and the benefit of any discounted capital raising or spin-off. So for companies that pay a generous dividend, the TSR is often a lot higher than the share price return. We note that for Orora the TSR over the last 3 years was -40%, which is better than the share price return mentioned above. The dividends paid by the company have thusly boosted the total shareholder return.
A Different Perspective
Investors in Orora had a tough year, with a total loss of 4.7% (including dividends), against a market gain of about 13%. However, keep in mind that even the best stocks will sometimes underperform the market over a twelve month period. Unfortunately, last year's performance may indicate unresolved challenges, given that it was worse than the annualised loss of 2% over the last half decade. We realise that Baron Rothschild has said investors should "buy when there is blood on the streets", but we caution that investors should first be sure they are buying a high quality business. It's always interesting to track share price performance over the longer term. But to understand Orora better, we need to consider many other factors. Case in point: We've spotted 2 warning signs for Orora you should be aware of, and 1 of them shouldn't be ignored.
Orora is not the only stock that insiders are buying. For those who like to find lesser know companies this free list of growing companies with recent insider purchasing, could be just the ticket.
Please note, the market returns quoted in this article reflect the market weighted average returns of stocks that currently trade on Australian exchanges.
New: AI Stock Screener & Alerts
Our new AI Stock Screener scans the market every day to uncover opportunities.
• Dividend Powerhouses (3%+ Yield)
• Undervalued Small Caps with Insider Buying
• High growth Tech and AI Companies
Or build your own from over 50 metrics.
Have feedback on this article? Concerned about the content? Get in touch with us directly. Alternatively, email editorial-team (at) simplywallst.com.
This article by Simply Wall St is general in nature. We provide commentary based on historical data and analyst forecasts only using an unbiased methodology and our articles are not intended to be financial advice. It does not constitute a recommendation to buy or sell any stock, and does not take account of your objectives, or your financial situation. We aim to bring you long-term focused analysis driven by fundamental data. Note that our analysis may not factor in the latest price-sensitive company announcements or qualitative material. Simply Wall St has no position in any stocks mentioned.
About ASX:ORA
Orora
Designs, manufactures, and supplies packaging products and services in Australia, New Zealand, the United States, and internationally.
Flawless balance sheet and fair value.
Similar Companies
Market Insights


Advertisement
Community Narratives
100% Patient Improvement in trial puts this $16M Biotech on the radar
Fair Value US$5.30|74.7% undervalued
JO
Community Contributor
PayPal's Future Growth Through Venmo and Merchant Solutions
Fair Value US$105.25|35.0% undervalued
ZW
Community Contributor
IREN's Bold Moves in Sustainable Bitcoin Mining & AI Data Centers
Fair Value US$26.54|1.5% undervalued
BL
Community Contributor