
Advertisement
- Australia
- /
- Medical Equipment
- /
- ASX:OIL
Investors ignore increasing losses at Optiscan Imaging (ASX:OIL) as stock jumps 15% this past week

When you buy shares in a company, it's worth keeping in mind the possibility that it could fail, and you could lose your money. But on a lighter note, a good company can see its share price rise well over 100%. Long term Optiscan Imaging Limited (ASX:OIL) shareholders would be well aware of this, since the stock is up 145% in five years. It's also up 42% in about a month.
Since the stock has added AU$13m to its market cap in the past week alone, let's see if underlying performance has been driving long-term returns.
View our latest analysis for Optiscan Imaging
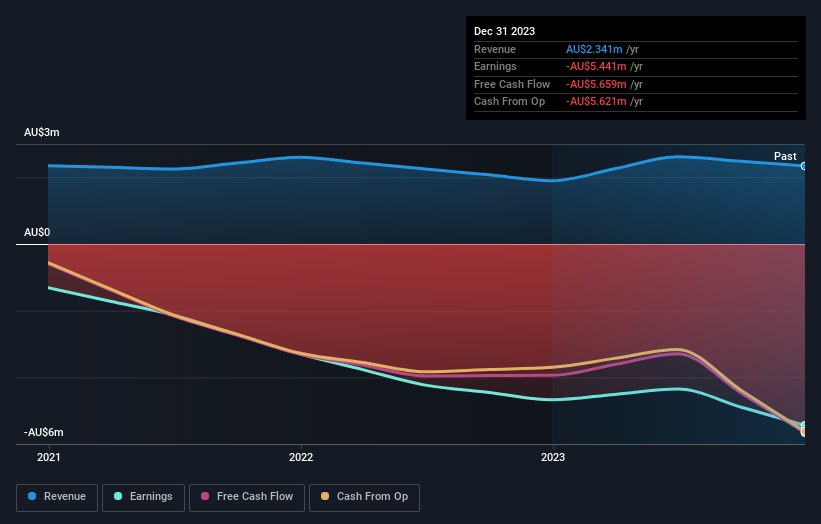
Because Optiscan Imaging made a loss in the last twelve months, we think the market is probably more focussed on revenue and revenue growth, at least for now. When a company doesn't make profits, we'd generally hope to see good revenue growth. As you can imagine, fast revenue growth, when maintained, often leads to fast profit growth.
For the last half decade, Optiscan Imaging can boast revenue growth at a rate of 8.0% per year. That's a pretty good long term growth rate. Broadly speaking, this solid progress may well be reflected by the healthy share price gain of 20% per year over five years. It's well worth monitoring the growth trend in revenue, because if growth accelerates, that might signal an opportunity. When a growth trend accelerates, be it in revenue or earnings, it can indicate an inflection point for the business, which is can often be an opportunity for investors.
The company's revenue and earnings (over time) are depicted in the image below (click to see the exact numbers).
It's good to see that there was some significant insider buying in the last three months. That's a positive. On the other hand, we think the revenue and earnings trends are much more meaningful measures of the business. Dive deeper into the earnings by checking this interactive graph of Optiscan Imaging's earnings, revenue and cash flow.
What About The Total Shareholder Return (TSR)?
We've already covered Optiscan Imaging's share price action, but we should also mention its total shareholder return (TSR). The TSR is a return calculation that accounts for the value of cash dividends (assuming that any dividend received was reinvested) and the calculated value of any discounted capital raisings and spin-offs. Optiscan Imaging hasn't been paying dividends, but its TSR of 150% exceeds its share price return of 145%, implying it has either spun-off a business, or raised capital at a discount; thereby providing additional value to shareholders.
A Different Perspective
We're pleased to report that Optiscan Imaging shareholders have received a total shareholder return of 34% over one year. Since the one-year TSR is better than the five-year TSR (the latter coming in at 20% per year), it would seem that the stock's performance has improved in recent times. Someone with an optimistic perspective could view the recent improvement in TSR as indicating that the business itself is getting better with time. It's always interesting to track share price performance over the longer term. But to understand Optiscan Imaging better, we need to consider many other factors. For example, we've discovered 5 warning signs for Optiscan Imaging (1 doesn't sit too well with us!) that you should be aware of before investing here.
Optiscan Imaging is not the only stock insiders are buying. So take a peek at this free list of small cap companies at attractive valuations which insiders have been buying.
Please note, the market returns quoted in this article reflect the market weighted average returns of stocks that currently trade on Australian exchanges.
New: AI Stock Screener & Alerts
Our new AI Stock Screener scans the market every day to uncover opportunities.
• Dividend Powerhouses (3%+ Yield)
• Undervalued Small Caps with Insider Buying
• High growth Tech and AI Companies
Or build your own from over 50 metrics.
Have feedback on this article? Concerned about the content? Get in touch with us directly. Alternatively, email editorial-team (at) simplywallst.com.
This article by Simply Wall St is general in nature. We provide commentary based on historical data and analyst forecasts only using an unbiased methodology and our articles are not intended to be financial advice. It does not constitute a recommendation to buy or sell any stock, and does not take account of your objectives, or your financial situation. We aim to bring you long-term focused analysis driven by fundamental data. Note that our analysis may not factor in the latest price-sensitive company announcements or qualitative material. Simply Wall St has no position in any stocks mentioned.
About ASX:OIL
Optiscan Imaging
Engages in the development, manufacture, and commercialization of endomicroscopic digital imaging technology solutions for medical, translational, and pre-clinical applications in Australia, Germany, China, and the United States.
Excellent balance sheet slight.
Market Insights

Advertisement
Community Narratives
Scaling up in building materials with smart M&A and growing profitability
Fair Value US$2.77|29.6% undervalued
CM
Community Contributor
Hims: The Platform Powering Personalised Healthcare
Fair Value US$114.01|49.1% undervalued
BL
Community Contributor
Undervalued lottery company with strong fundamentals
Fair Value AU$15.00|35.8% undervalued
RO
Community Contributor
Proximus, transferring money from the impatient to the patient investor
Fair Value €16.62|55.2% undervalued
AX
Community Contributor