- Australia
- /
- Capital Markets
- /
- ASX:PCG
Pengana Capital Group's(ASX:PCG) Share Price Is Down 51% Over The Past Three Years.


Pengana Capital Group Limited (ASX:PCG) shareholders should be happy to see the share price up 10% in the last quarter. But that doesn't change the fact that the returns over the last three years have been less than pleasing. In fact, the share price is down 51% in the last three years, falling well short of the market return.
Check out our latest analysis for Pengana Capital Group
There is no denying that markets are sometimes efficient, but prices do not always reflect underlying business performance. One imperfect but simple way to consider how the market perception of a company has shifted is to compare the change in the earnings per share (EPS) with the share price movement.
Pengana Capital Group became profitable within the last five years. We would usually expect to see the share price rise as a result. So it's worth looking at other metrics to try to understand the share price move.
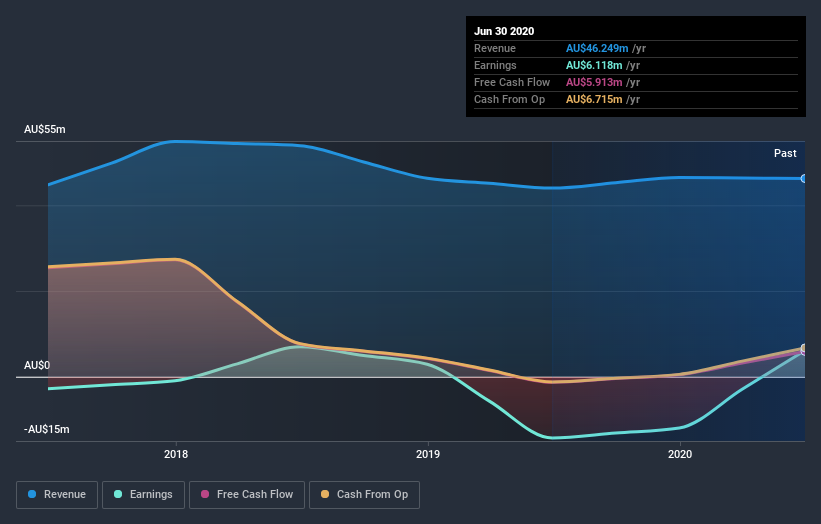
We note that the dividend seems healthy enough, so that probably doesn't explain the share price drop. However, the weak share price might be related to the fact revenue has been disappearing at a rate of 4.3% each year, over three years. This could have some investors worried about the longer term growth potential (or lack thereof).
The company's revenue and earnings (over time) are depicted in the image below (click to see the exact numbers).
We like that insiders have been buying shares in the last twelve months. Even so, future earnings will be far more important to whether current shareholders make money. It might be well worthwhile taking a look at our free report on Pengana Capital Group's earnings, revenue and cash flow.
What About Dividends?
When looking at investment returns, it is important to consider the difference between total shareholder return (TSR) and share price return. The TSR is a return calculation that accounts for the value of cash dividends (assuming that any dividend received was reinvested) and the calculated value of any discounted capital raisings and spin-offs. Arguably, the TSR gives a more comprehensive picture of the return generated by a stock. In the case of Pengana Capital Group, it has a TSR of -45% for the last 3 years. That exceeds its share price return that we previously mentioned. This is largely a result of its dividend payments!
A Different Perspective
It's nice to see that Pengana Capital Group shareholders have gained 25% (in total) over the last year. That includes the value of the dividend. That certainly beats the loss of about 13% per year over three years. The optimist would say this is evidence that the stock has bottomed, and better days lie ahead. I find it very interesting to look at share price over the long term as a proxy for business performance. But to truly gain insight, we need to consider other information, too. For instance, we've identified 1 warning sign for Pengana Capital Group that you should be aware of.
There are plenty of other companies that have insiders buying up shares. You probably do not want to miss this free list of growing companies that insiders are buying.
Please note, the market returns quoted in this article reflect the market weighted average returns of stocks that currently trade on AU exchanges.
When trading Pengana Capital Group or any other investment, use the platform considered by many to be the Professional's Gateway to the Worlds Market, Interactive Brokers. You get the lowest-cost* trading on stocks, options, futures, forex, bonds and funds worldwide from a single integrated account. Promoted
If you're looking to trade Pengana Capital Group, open an account with the lowest-cost platform trusted by professionals, Interactive Brokers.
With clients in over 200 countries and territories, and access to 160 markets, IBKR lets you trade stocks, options, futures, forex, bonds and funds from a single integrated account.
Enjoy no hidden fees, no account minimums, and FX conversion rates as low as 0.03%, far better than what most brokers offer.
Sponsored ContentNew: Manage All Your Stock Portfolios in One Place
We've created the ultimate portfolio companion for stock investors, and it's free.
• Connect an unlimited number of Portfolios and see your total in one currency
• Be alerted to new Warning Signs or Risks via email or mobile
• Track the Fair Value of your stocks
This article by Simply Wall St is general in nature. It does not constitute a recommendation to buy or sell any stock, and does not take account of your objectives, or your financial situation. We aim to bring you long-term focused analysis driven by fundamental data. Note that our analysis may not factor in the latest price-sensitive company announcements or qualitative material. Simply Wall St has no position in any stocks mentioned.
*Interactive Brokers Rated Lowest Cost Broker by StockBrokers.com Annual Online Review 2020
Have feedback on this article? Concerned about the content? Get in touch with us directly. Alternatively, email editorial-team (at) simplywallst.com.
About ASX:PCG
Pengana Capital Group
Pengana Holdings Pty Ltd. is a publicly owned investment manager.
Flawless balance sheet with reasonable growth potential.
Similar Companies
Market Insights

Community Narratives
