- Australia
- /
- Commercial Services
- /
- ASX:MAD
Reflecting on Mader Group's (ASX:MAD) Share Price Returns Over The Last Year

While not a mind-blowing move, it is good to see that the Mader Group Limited (ASX:MAD) share price has gained 18% in the last three months. But that is minimal compensation for the share price under-performance over the last year. In fact, the price has declined 11% in a year, falling short of the returns you could get by investing in an index fund.
View our latest analysis for Mader Group
To quote Buffett, 'Ships will sail around the world but the Flat Earth Society will flourish. There will continue to be wide discrepancies between price and value in the marketplace...' One imperfect but simple way to consider how the market perception of a company has shifted is to compare the change in the earnings per share (EPS) with the share price movement.
Even though the Mader Group share price is down over the year, its EPS actually improved. Of course, the situation might betray previous over-optimism about growth.
By glancing at these numbers, we'd posit that the the market had expectations of much higher growth, last year. But looking to other metrics might better explain the share price change.
Mader Group managed to grow revenue over the last year, which is usually a real positive. Since the fundamental metrics don't readily explain the share price drop, there might be an opportunity if the market has overreacted.
The company's revenue and earnings (over time) are depicted in the image below (click to see the exact numbers).
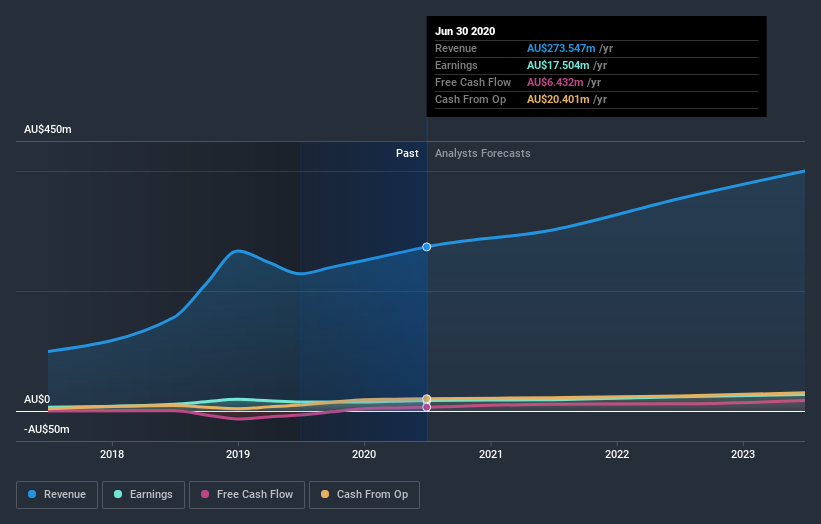
We consider it positive that insiders have made significant purchases in the last year. Even so, future earnings will be far more important to whether current shareholders make money. So it makes a lot of sense to check out what analysts think Mader Group will earn in the future (free profit forecasts).
What About Dividends?
As well as measuring the share price return, investors should also consider the total shareholder return (TSR). Whereas the share price return only reflects the change in the share price, the TSR includes the value of dividends (assuming they were reinvested) and the benefit of any discounted capital raising or spin-off. It's fair to say that the TSR gives a more complete picture for stocks that pay a dividend. We note that for Mader Group the TSR over the last year was -8.2%, which is better than the share price return mentioned above. And there's no prize for guessing that the dividend payments largely explain the divergence!
A Different Perspective
Given that the market gained 4.0% in the last year, Mader Group shareholders might be miffed that they lost 8.2% (even including dividends). While the aim is to do better than that, it's worth recalling that even great long-term investments sometimes underperform for a year or more. It's great to see a nice little 18% rebound in the last three months. Let's just hope this isn't the widely-feared 'dead cat bounce' (which would indicate further declines to come). I find it very interesting to look at share price over the long term as a proxy for business performance. But to truly gain insight, we need to consider other information, too. Case in point: We've spotted 2 warning signs for Mader Group you should be aware of.
Mader Group is not the only stock that insiders are buying. For those who like to find winning investments this free list of growing companies with recent insider purchasing, could be just the ticket.
Please note, the market returns quoted in this article reflect the market weighted average returns of stocks that currently trade on AU exchanges.
If you decide to trade Mader Group, use the lowest-cost* platform that is rated #1 Overall by Barron’s, Interactive Brokers. Trade stocks, options, futures, forex, bonds and funds on 135 markets, all from a single integrated account. Promoted
Mobile Infrastructure for Defense and Disaster
The next wave in robotics isn't humanoid. Its fully autonomous towers delivering 5G, ISR, and radar in under 30 minutes, anywhere.
Get the investor briefing before the next round of contracts
Sponsored On Behalf of CiTechNew: Manage All Your Stock Portfolios in One Place
We've created the ultimate portfolio companion for stock investors, and it's free.
• Connect an unlimited number of Portfolios and see your total in one currency
• Be alerted to new Warning Signs or Risks via email or mobile
• Track the Fair Value of your stocks
This article by Simply Wall St is general in nature. It does not constitute a recommendation to buy or sell any stock, and does not take account of your objectives, or your financial situation. We aim to bring you long-term focused analysis driven by fundamental data. Note that our analysis may not factor in the latest price-sensitive company announcements or qualitative material. Simply Wall St has no position in any stocks mentioned.
*Interactive Brokers Rated Lowest Cost Broker by StockBrokers.com Annual Online Review 2020
Have feedback on this article? Concerned about the content? Get in touch with us directly. Alternatively, email editorial-team (at) simplywallst.com.
About ASX:MAD
Mader Group
A contracting company, provides specialist technical services in the mining, energy, and industrial sectors in Australia, North America, and internationally.
Flawless balance sheet with solid track record.
Similar Companies
Market Insights

Weekly Picks

THE KINGDOM OF BROWN GOODS: WHY MGPI IS BEING CRUSHED BY INVENTORY & PRIMED FOR RESURRECTION


Why Vertical Aerospace (NYSE: EVTL) is Worth Possibly Over 13x its Current Price


The Quiet Giant That Became AI’s Power Grid
Recently Updated Narratives


MINISO's fair value is projected at 26.69 with an anticipated PE ratio shift of 20x

Fiverr International will transform the freelance industry with AI-powered growth

Stride Stock: Online Education Finds Its Second Act
Popular Narratives


MicroVision will explode future revenue by 380.37% with a vision towards success


Crazy Undervalued 42 Baggers Silver Play (Active & Running Mine)


