- Australia
- /
- Commercial Services
- /
- ASX:MAD
Is Mader Group Limited's (ASX:MAD) Stock's Recent Performance Being Led By Its Attractive Financial Prospects?

Most readers would already be aware that Mader Group's (ASX:MAD) stock increased significantly by 25% over the past three months. Given the company's impressive performance, we decided to study its financial indicators more closely as a company's financial health over the long-term usually dictates market outcomes. Particularly, we will be paying attention to Mader Group's ROE today.
ROE or return on equity is a useful tool to assess how effectively a company can generate returns on the investment it received from its shareholders. Put another way, it reveals the company's success at turning shareholder investments into profits.
View our latest analysis for Mader Group
How To Calculate Return On Equity?
The formula for ROE is:
Return on Equity = Net Profit (from continuing operations) ÷ Shareholders' Equity
So, based on the above formula, the ROE for Mader Group is:
36% = AU$15m ÷ AU$42m (Based on the trailing twelve months to December 2019).
The 'return' is the profit over the last twelve months. One way to conceptualize this is that for each A$1 of shareholders' capital it has, the company made A$0.36 in profit.
Why Is ROE Important For Earnings Growth?
So far, we've learnt that ROE is a measure of a company's profitability. We now need to evaluate how much profit the company reinvests or "retains" for future growth which then gives us an idea about the growth potential of the company. Assuming everything else remains unchanged, the higher the ROE and profit retention, the higher the growth rate of a company compared to companies that don't necessarily bear these characteristics.
Mader Group's Earnings Growth And 36% ROE
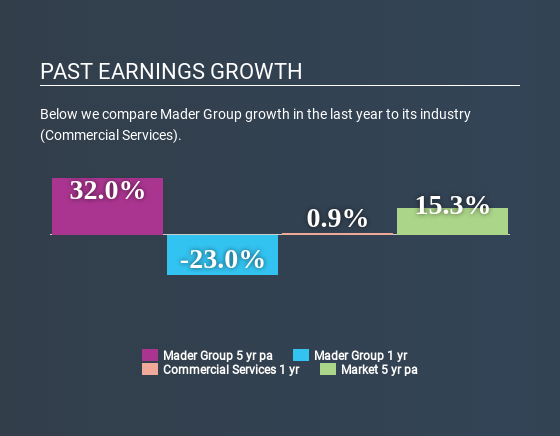
Firstly, we acknowledge that Mader Group has a significantly high ROE. Secondly, even when compared to the industry average of 9.0% the company's ROE is quite impressive. Under the circumstances, Mader Group's considerable five year net income growth of 32% was to be expected.
We then compared Mader Group's net income growth with the industry and we're pleased to see that the company's growth figure is higher when compared with the industry which has a growth rate of 23% in the same period.
The basis for attaching value to a company is, to a great extent, tied to its earnings growth. It’s important for an investor to know whether the market has priced in the company's expected earnings growth (or decline). By doing so, they will have an idea if the stock is headed into clear blue waters or if swampy waters await. One good indicator of expected earnings growth is the P/E ratio which determines the price the market is willing to pay for a stock based on its earnings prospects. So, you may want to check if Mader Group is trading on a high P/E or a low P/E, relative to its industry.
Is Mader Group Efficiently Re-investing Its Profits?
Mader Group's three-year median payout ratio to shareholders is 14%, which is quite low. This implies that the company is retaining 86% of its profits. So it looks like Mader Group is reinvesting profits heavily to grow its business, which shows in its earnings growth.
Our latest analyst data shows that the future payout ratio of the company is expected to rise to 36% over the next three years. Despite the higher expected payout ratio, the company's ROE is not expected to change by much.
Summary
Overall, we are quite pleased with Mader Group's performance. Particularly, we like that the company is reinvesting heavily into its business, and at a high rate of return. Unsurprisingly, this has led to an impressive earnings growth. Having said that, the company's earnings growth is expected to slow down, as forecasted in the current analyst estimates. To know more about the latest analysts predictions for the company, check out this visualization of analyst forecasts for the company.
When trading Mader Group or any other investment, use the platform considered by many to be the Professional's Gateway to the Worlds Market, Interactive Brokers. You get the lowest-cost* trading on stocks, options, futures, forex, bonds and funds worldwide from a single integrated account.Promoted
The New Payments ETF Is Live on NASDAQ:
Money is moving to real-time rails, and a newly listed ETF now gives investors direct exposure. Fast settlement. Institutional custody. Simple access.
Explore how this launch could reshape portfolios
Sponsored ContentNew: Manage All Your Stock Portfolios in One Place
We've created the ultimate portfolio companion for stock investors, and it's free.
• Connect an unlimited number of Portfolios and see your total in one currency
• Be alerted to new Warning Signs or Risks via email or mobile
• Track the Fair Value of your stocks
This article by Simply Wall St is general in nature. It does not constitute a recommendation to buy or sell any stock, and does not take account of your objectives, or your financial situation. We aim to bring you long-term focused analysis driven by fundamental data. Note that our analysis may not factor in the latest price-sensitive company announcements or qualitative material. Simply Wall St has no position in any stocks mentioned.
*Interactive Brokers Rated Lowest Cost Broker by StockBrokers.com Annual Online Review 2020
Have feedback on this article? Concerned about the content? Get in touch with us directly. Alternatively, email editorial-team@simplywallst.com.
About ASX:MAD
Mader Group
A contracting company, provides specialist technical services in the mining, energy, and industrial sectors in Australia, North America, and internationally.
Flawless balance sheet with solid track record.
Similar Companies
Market Insights

Weekly Picks

THE KINGDOM OF BROWN GOODS: WHY MGPI IS BEING CRUSHED BY INVENTORY & PRIMED FOR RESURRECTION


Why Vertical Aerospace (NYSE: EVTL) is Worth Possibly Over 13x its Current Price


The Quiet Giant That Became AI’s Power Grid
Recently Updated Narratives


MINISO's fair value is projected at 26.69 with an anticipated PE ratio shift of 20x

Fiverr International will transform the freelance industry with AI-powered growth

Stride Stock: Online Education Finds Its Second Act
Popular Narratives


MicroVision will explode future revenue by 380.37% with a vision towards success


Crazy Undervalued 42 Baggers Silver Play (Active & Running Mine)


