
Advertisement
Should You Be Tempted To Sell Westpac Banking Corporation (ASX:WBC) Because Of Its P/E Ratio?
The goal of this article is to teach you how to use price to earnings ratios (P/E ratios). To keep it practical, we'll show how Westpac Banking Corporation's (ASX:WBC) P/E ratio could help you assess the value on offer. Westpac Banking has a P/E ratio of 12.47, based on the last twelve months. In other words, at today's prices, investors are paying A$12.47 for every A$1 in prior year profit.
Check out our latest analysis for Westpac Banking
How Do You Calculate Westpac Banking's P/E Ratio?
The formula for price to earnings is:
Price to Earnings Ratio = Price per Share ÷ Earnings per Share (EPS)
Or for Westpac Banking:
P/E of 12.47 = A$24.50 ÷ A$1.96 (Based on the trailing twelve months to September 2019.)
Is A High P/E Ratio Good?
A higher P/E ratio means that investors are paying a higher price for each A$1 of company earnings. That isn't a good or a bad thing on its own, but a high P/E means that buyers have a higher opinion of the business's prospects, relative to stocks with a lower P/E.
How Does Westpac Banking's P/E Ratio Compare To Its Peers?
We can get an indication of market expectations by looking at the P/E ratio. You can see in the image below that the average P/E (11.3) for companies in the banks industry is lower than Westpac Banking's P/E.
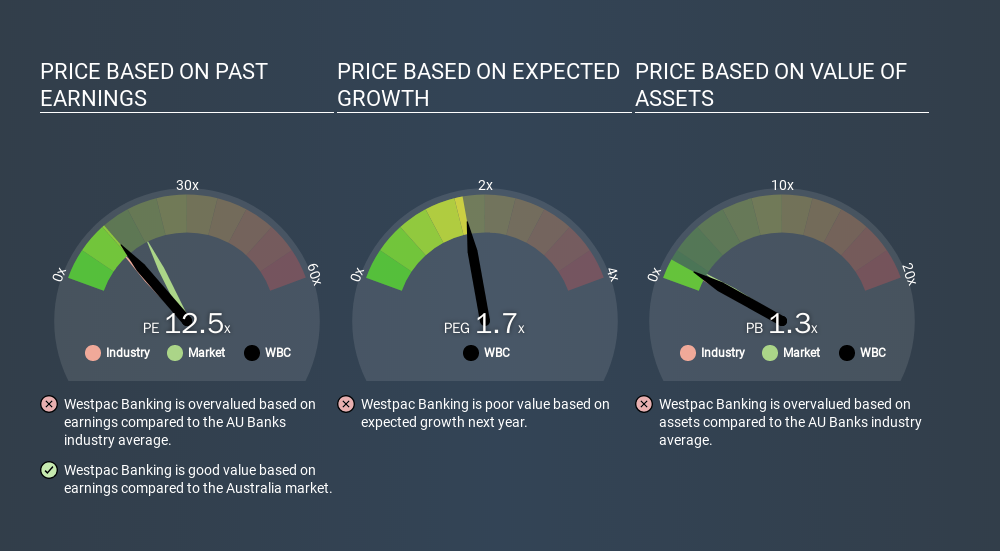
That means that the market expects Westpac Banking will outperform other companies in its industry. Clearly the market expects growth, but it isn't guaranteed. So further research is always essential. I often monitor director buying and selling.
How Growth Rates Impact P/E Ratios
If earnings fall then in the future the 'E' will be lower. That means unless the share price falls, the P/E will increase in a few years. A higher P/E should indicate the stock is expensive relative to others -- and that may encourage shareholders to sell.
Westpac Banking shrunk earnings per share by 17% over the last year. And it has shrunk its earnings per share by 4.1% per year over the last five years. This might lead to muted expectations.
A Limitation: P/E Ratios Ignore Debt and Cash In The Bank
The 'Price' in P/E reflects the market capitalization of the company. That means it doesn't take debt or cash into account. Theoretically, a business can improve its earnings (and produce a lower P/E in the future) by investing in growth. That means taking on debt (or spending its cash).
Such spending might be good or bad, overall, but the key point here is that you need to look at debt to understand the P/E ratio in context.
So What Does Westpac Banking's Balance Sheet Tell Us?
Westpac Banking has net debt worth a very significant 185% of its market capitalization. This level of debt justifies a relatively low P/E, so remain cognizant of the debt, if you're comparing it to other stocks.
The Bottom Line On Westpac Banking's P/E Ratio
Westpac Banking has a P/E of 12.5. That's below the average in the AU market, which is 18.7. When you consider that the company has significant debt, and didn't grow EPS last year, it isn't surprising that the market has muted expectations.
When the market is wrong about a stock, it gives savvy investors an opportunity. If it is underestimating a company, investors can make money by buying and holding the shares until the market corrects itself. So this free report on the analyst consensus forecasts could help you make a master move on this stock.
You might be able to find a better buy than Westpac Banking. If you want a selection of possible winners, check out this free list of interesting companies that trade on a P/E below 20 (but have proven they can grow earnings).
If you spot an error that warrants correction, please contact the editor at editorial-team@simplywallst.com. This article by Simply Wall St is general in nature. It does not constitute a recommendation to buy or sell any stock, and does not take account of your objectives, or your financial situation. Simply Wall St has no position in the stocks mentioned.
We aim to bring you long-term focused research analysis driven by fundamental data. Note that our analysis may not factor in the latest price-sensitive company announcements or qualitative material. Thank you for reading.
About ASX:WBC
Westpac Banking
Provides banking and other financial services in Australia, New Zealand, the Pacific Islands, Asia, the Americas, and Europe.
Excellent balance sheet with acceptable track record.
Similar Companies
Market Insights

Advertisement
Community Narratives
A formidable player in AI and enterprise computing.
Fair Value US$210.00|13.6% overvalued
CO
Community Contributor
IREN's Bold Moves in Sustainable Bitcoin Mining & AI Data Centers
Fair Value US$89.00|23.6% undervalued
BL
Community Contributor
Cooling the Champions: The Aussie Tech Behind F1's Victories
Fair Value AU$12.40|40.6% undervalued
TR
Community Contributor