Is UNIQA Insurance Group AG's (VIE:UQA) Recent Performance Tethered To Its Attractive Financial Prospects?


Most readers would already know that UNIQA Insurance Group's (VIE:UQA) stock increased by 4.4% over the past month. Given its impressive performance, we decided to study the company's key financial indicators as a company's long-term fundamentals usually dictate market outcomes. Particularly, we will be paying attention to UNIQA Insurance Group's ROE today.
Return on Equity or ROE is a test of how effectively a company is growing its value and managing investors’ money. In short, ROE shows the profit each dollar generates with respect to its shareholder investments.
View our latest analysis for UNIQA Insurance Group
How Is ROE Calculated?
Return on equity can be calculated by using the formula:
Return on Equity = Net Profit (from continuing operations) ÷ Shareholders' Equity
So, based on the above formula, the ROE for UNIQA Insurance Group is:
18% = €405m ÷ €2.2b (Based on the trailing twelve months to September 2023).
The 'return' refers to a company's earnings over the last year. That means that for every €1 worth of shareholders' equity, the company generated €0.18 in profit.
What Is The Relationship Between ROE And Earnings Growth?
Thus far, we have learned that ROE measures how efficiently a company is generating its profits. Based on how much of its profits the company chooses to reinvest or "retain", we are then able to evaluate a company's future ability to generate profits. Assuming all else is equal, companies that have both a higher return on equity and higher profit retention are usually the ones that have a higher growth rate when compared to companies that don't have the same features.
A Side By Side comparison of UNIQA Insurance Group's Earnings Growth And 18% ROE
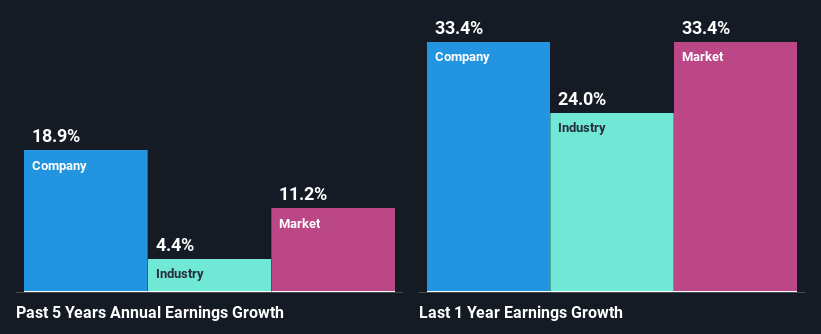
To begin with, UNIQA Insurance Group seems to have a respectable ROE. On comparing with the average industry ROE of 13% the company's ROE looks pretty remarkable. This probably laid the ground for UNIQA Insurance Group's moderate 19% net income growth seen over the past five years.
We then compared UNIQA Insurance Group's net income growth with the industry and we're pleased to see that the company's growth figure is higher when compared with the industry which has a growth rate of 4.4% in the same 5-year period.
Earnings growth is an important metric to consider when valuing a stock. The investor should try to establish if the expected growth or decline in earnings, whichever the case may be, is priced in. This then helps them determine if the stock is placed for a bright or bleak future. Is UNIQA Insurance Group fairly valued compared to other companies? These 3 valuation measures might help you decide.
Is UNIQA Insurance Group Using Its Retained Earnings Effectively?
UNIQA Insurance Group has a three-year median payout ratio of 47%, which implies that it retains the remaining 53% of its profits. This suggests that its dividend is well covered, and given the decent growth seen by the company, it looks like management is reinvesting its earnings efficiently.
Moreover, UNIQA Insurance Group is determined to keep sharing its profits with shareholders which we infer from its long history of paying a dividend for at least ten years.
Summary
In total, we are pretty happy with UNIQA Insurance Group's performance. In particular, it's great to see that the company is investing heavily into its business and along with a high rate of return, that has resulted in a sizeable growth in its earnings. If the company continues to grow its earnings the way it has, that could have a positive impact on its share price given how earnings per share influence long-term share prices. Remember, the price of a stock is also dependent on the perceived risk. Therefore investors must keep themselves informed about the risks involved before investing in any company. Our risks dashboard will have the 1 risk we have identified for UNIQA Insurance Group.
New: AI Stock Screener & Alerts
Our new AI Stock Screener scans the market every day to uncover opportunities.
• Dividend Powerhouses (3%+ Yield)
• Undervalued Small Caps with Insider Buying
• High growth Tech and AI Companies
Or build your own from over 50 metrics.
Have feedback on this article? Concerned about the content? Get in touch with us directly. Alternatively, email editorial-team (at) simplywallst.com.
This article by Simply Wall St is general in nature. We provide commentary based on historical data and analyst forecasts only using an unbiased methodology and our articles are not intended to be financial advice. It does not constitute a recommendation to buy or sell any stock, and does not take account of your objectives, or your financial situation. We aim to bring you long-term focused analysis driven by fundamental data. Note that our analysis may not factor in the latest price-sensitive company announcements or qualitative material. Simply Wall St has no position in any stocks mentioned.
About WBAG:UQA
UNIQA Insurance Group
Operates as an insurance company in Austria, and Central and Eastern Europe.
Solid track record, good value and pays a dividend.

